NIFTY 50 is holding a tight equilibrium around 22,503.20 as we head through the weekly expiry cycle, creating high-probability setup zones for breakout traders and premium decay for option sellers.
While the higher 1-hour structure maintains caution with a macro bearish filter, short-term 15-minute and 5-minute charts display resilient intraday buyer accumulation. Expect rapid theta decay and volatility expansion as expiry approaches. Option sellers can look toward the 22,650 CE and 22,180 PE strikes for range decay, while intraday futures traders should wait for a clean 5-minute candle confirmation outside the 22,481 – 22,529 breakout corridor.
Open interest around 22,503.20 reflects balanced participation from both Call and Put writers for this weekly expiry cycle. Neutral RSI (52) keeps momentum pinned inside the 22,481–22,529 range. Avoid unconfirmed directional bets inside this mid-range zone.
02 1H Macro Structural View
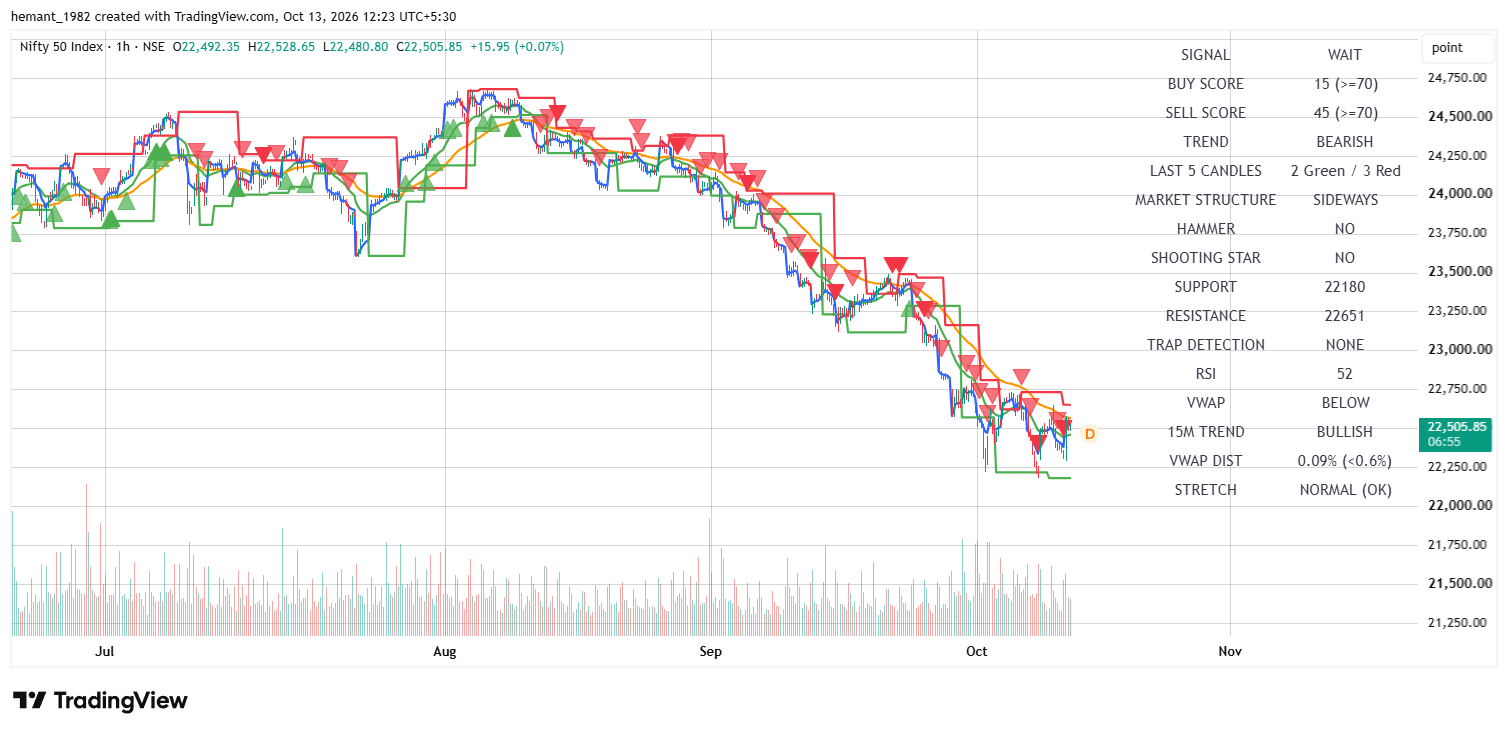
NIFTY 50 1H Chart — Broad downtrend consolidation with macro floor support at 22,180 and resistance ceiling at 22,651.
Timeframe Metric
Institutional Value
Technical & Strategy Interpretation
1H Trend / Signal
BEARISH / WAIT
Macro filter active; Buy Score 15 vs Sell Score 45.
RSI (14) Momentum
52 (Neutral)
Equilibrium phase; awaiting volume expansion for trend.
Candle Structure
2 Green / 3 Red
Market Structure marked SIDEWAYS with Trap Detection: NONE.
VWAP & Stretch
BELOW (0.09%)
VWAP Distance <0.6% indicates NORMAL (OK) price stretch.
Major Resistance
22,651
Heavy Call Writing — Resistance ceiling for short strangles.
Major Support
22,180
Heavy Put Writing — Defense floor preserving macro structure.
The 1-hour macro view outlines an ongoing corrective channel. Sell score dominates buy score (45 vs 15), advising traders that overhead rallies will likely encounter strong institutional supply near 22,651.
03 15M Tactical Setup
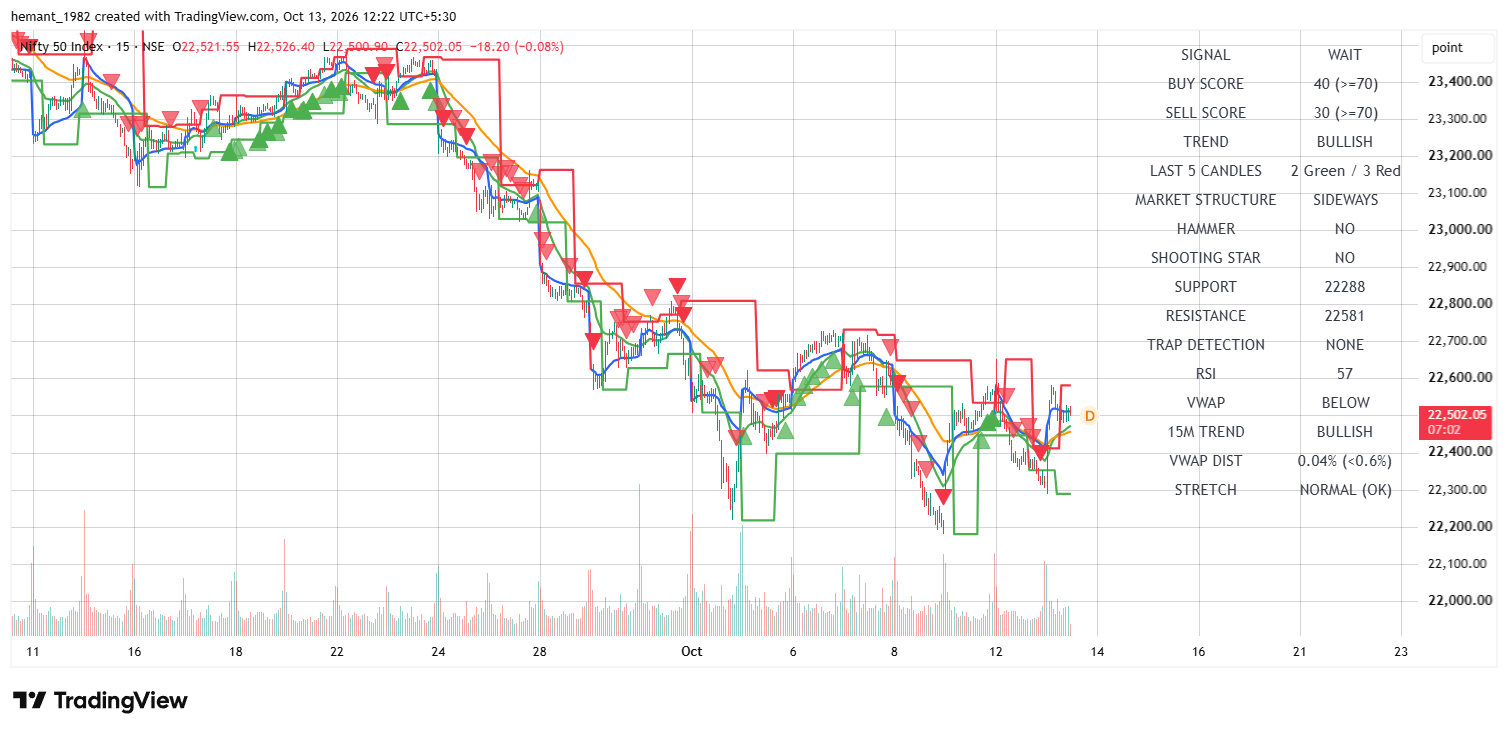
NIFTY 50 15M Chart — Intermediate tactical bounce holding above the 22,288 support level.
Timeframe Metric
Institutional Value
Technical & Strategy Interpretation
15M Trend / Signal
BULLISH / WAIT
Intermediate recovery active; Buy Score 40 vs Sell Score 30.
RSI (14) Momentum
57 (Positive)
Supports tactical long entries on pullbacks toward support.
Candle Structure
2 Green / 3 Red
Market Structure SIDEWAYS; Hammer: NO, Shooting Star: NO.
VWAP & Stretch
BELOW (0.04%)
Tight VWAP distance (<0.6%) signals NORMAL (OK) compression.
Tactical Resistance
22,581
Upside target for long futures and 22,550 CE contracts.
Tactical Support
22,288
Swing support floor; breach below negates intermediate recovery.
The 15-minute intermediate structure favors tactical buyers above 22,288. Sustained momentum opens a test of the 22,581 resistance target.
04 5M Execution & Scalper View
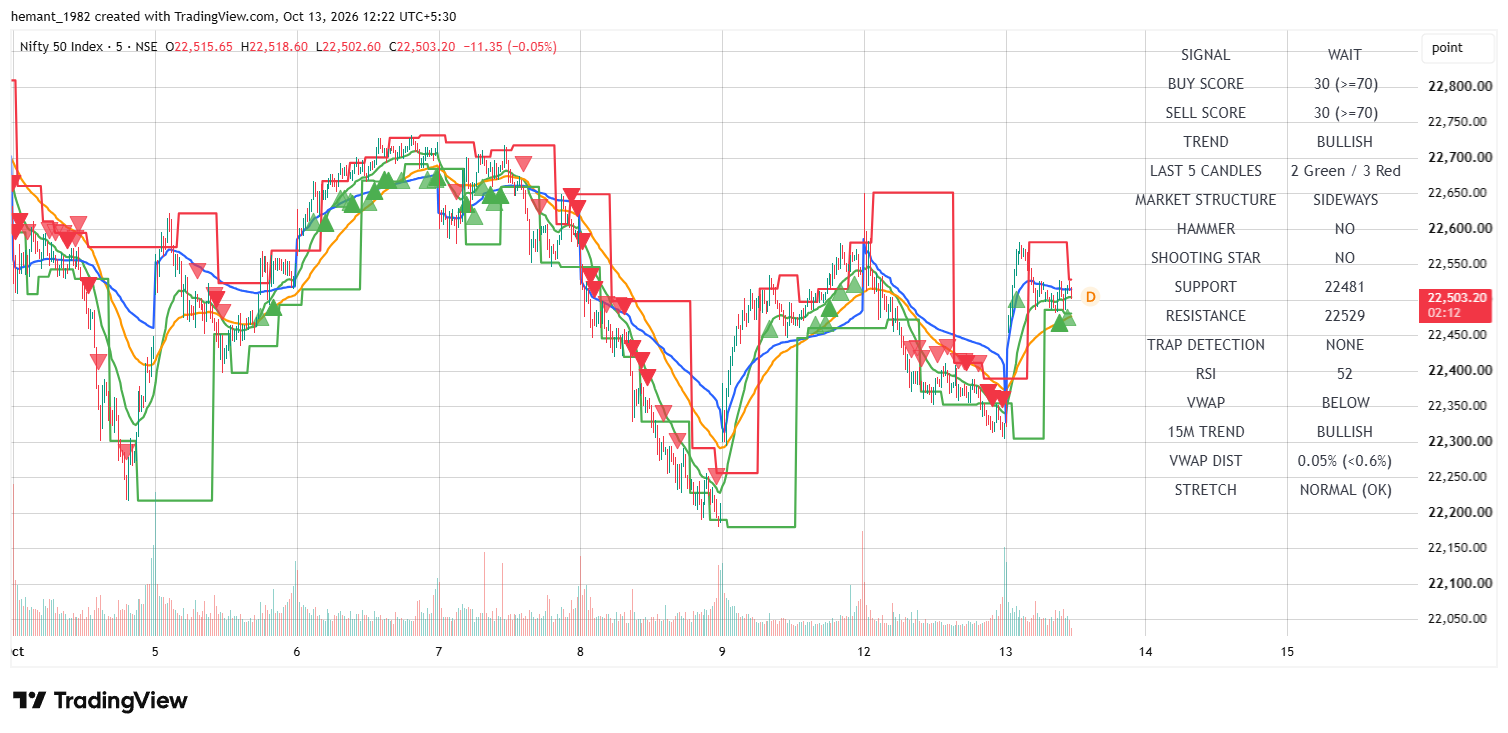
NIFTY 50 5M Chart — Scalp grid showing tight range compression between 22,481 and 22,529.
Timeframe Metric
Institutional Value
Technical & Strategy Interpretation
5M Trend / Signal
BULLISH / WAIT
High-frequency scalp alignment; Buy Score 30 vs Sell Score 30.
RSI (14) Momentum
52 (Neutral)
Intraday momentum balanced inside micro channel.
Candle Structure
2 Green / 3 Red
Market Structure SIDEWAYS; Trap Detection: NONE.
VWAP & Stretch
BELOW (0.05%)
Price trading at micro discount; VWAP stretch NORMAL (OK).
Scalp Resistance
22,529
Breakout trigger; buy 22,550 CE on a 5M close above.
Scalp Support
22,481
Breakdown trigger; buy 22,450 PE on a 5M close below.
High-frequency scalpers should remain patient while price oscillates between 22,481 and 22,529. Enter directionally only after candle validation.
05 Institutional Price Map & Strike Confluence
Price Level
Role & Timeframe
Derivatives & Strike Implications
22,651
1H Major Resistance
Heavy CE Writing Zone — Premium collection ceiling for short strangles.
22,581
15M Tactical Resistance
Upside target for 22,550 CE buyers and long futures scalps.
Equilibrium pivot; elevated time-decay zone for ATM options.
22,481
5M Intraday Support
Bearish breakdown level; activates 22,450 PE entry.
22,288
15M Tactical Support
Intermediate downside target on trend continuation.
22,180
1H Major Support Floor
Heavy PE Writing Wall — Institutional defense line protecting macro trend.
06 Professional Market Outlook
Multi-timeframe analysis emphasizes patience during range compression. Let institutional breakout volume confirm your trade direction around 22,481–22,529.
Bottom Line Execution Plan
Range-Bound Neutral Stance. Wait for a 5M Breakout.
Use strict trailing stops, avoid holding unhedged options inside mid-range chop, and trade systematically level-to-level.
Educational Disclaimer: This technical market report is published strictly for educational purposes. Futures, options, and derivatives trading involve significant risk of financial loss. Content does not constitute investment advice or direct buy/sell recommendations. Always consult a certified financial advisor before trading derivatives.