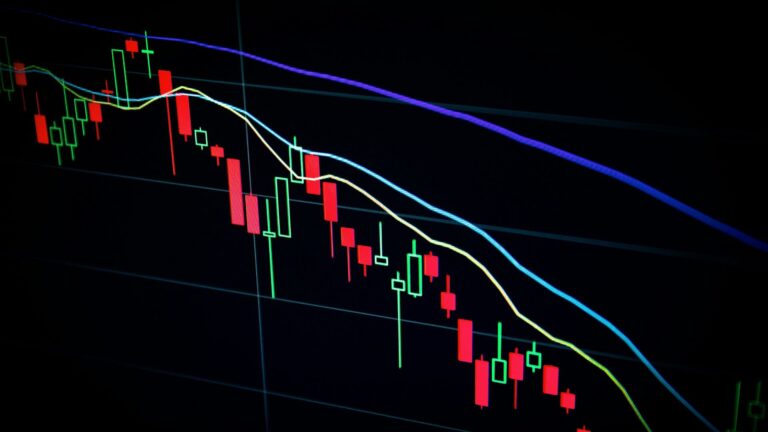
Forex Market Structure: How Professional Traders Read Trend, Liquidity, Volatility and Breakouts
Foreign exchange trading is often presented as a battle between indicators. One trader watches moving averages, another prefers RSI, while someone else waits for a familiar candlestick pattern. But professional market analysis starts from a different question: what is the market structure actually telling us?
Forex prices are constantly moving between areas of liquidity, previous highs and lows, consolidation zones, breakout points and changing volatility conditions. A chart may look chaotic when viewed candle by candle, yet much of that apparent randomness becomes easier to interpret when price is analysed as a sequence of structural events.
This is why experienced traders often focus on market structure, liquidity, volatility and execution rather than relying on a single indicator to predict the next candle.
The global scale of the foreign exchange market reinforces why this approach matters. The Bank for International Settlements reported that OTC foreign exchange turnover reached approximately $9.6 trillion per day in April 2025. Such enormous liquidity makes Forex one of the world’s most important financial markets, but it also means that price behaviour can be influenced by multiple timeframes, institutions, algorithms, hedging flows and changing volatility conditions.
Table of Contents
- Why Market Structure Matters More Than Indicator Signals
- How to Identify the Real Trend
- Understanding Liquidity and Stop Clusters
- Why Forex Breakouts Fail
- Using Volatility to Improve Trade Selection
- The Multi-Timeframe Structure Framework
- Combining Momentum With Structure
- Risk Management Through Structural Invalidation
- Execution: Turning Analysis Into a Trade
- A Professional Forex Analysis Framework
- Common Structural Analysis Mistakes
- Further Reading & References
- Conclusion
Why Market Structure Matters More Than Indicator Signals
Indicators are useful because they transform price data into measurable information. Moving averages can help identify trend direction, RSI can describe momentum conditions, and ATR can estimate recent volatility. The problem begins when traders treat an indicator signal as an independent trading thesis.
A bullish RSI reading does not automatically mean price will rise. A moving-average crossover does not guarantee a sustained trend. Likewise, a breakout candle does not necessarily mean the market has entered a new directional phase.
Indicators describe characteristics of price. Market structure describes the relationship between important price events.
A basic structural framework begins with swing highs and swing lows. In an advancing market, traders generally look for a sequence of higher highs and higher lows. In a declining market, lower lows and lower highs become important. A range develops when price repeatedly fails to establish a sustained sequence in either direction.
| Market Condition | Typical Structural Characteristics |
|---|---|
| Uptrend | Higher highs and higher lows with successful bullish continuation. |
| Downtrend | Lower lows and lower highs with sustained selling pressure. |
| Range | Repeated rejection between identifiable support and resistance areas. |
| Transition | Existing trend begins losing structural control and opposing pressure develops. |
| Expansion | Price leaves a compressed range and volatility increases sharply. |
This framework does not predict the future. Instead, it establishes a logical map of what has already happened and what would need to happen next for the market thesis to remain valid.
That distinction is important. A technical framework should not be designed to make traders feel certain. It should help them make decisions under uncertainty.
How to Identify the Real Trend
One of the most common Forex mistakes is defining a trend using only a single timeframe. A currency pair can be bullish on a five-minute chart while remaining firmly bearish on the four-hour chart.
That is not necessarily a contradiction. It simply means the market is being observed at different structural scales.
Professional analysis therefore separates primary structure from intermediate and tactical structure.
Primary Structure
The primary structure is normally observed on a higher timeframe such as the daily or four-hour chart. It answers the question: What is the broader market environment?
At this level, traders can identify major swing points, prolonged trends, large consolidation ranges and important structural failures.
Intermediate Structure
The intermediate timeframe can reveal whether price is correcting, consolidating or attempting to resume the broader trend.
This layer is particularly useful because many apparent reversals on lower timeframes are actually ordinary corrections within a larger trend.
Tactical Structure
The lower timeframe is where execution often occurs. It helps traders identify the specific breakout, pullback, rejection or continuation pattern that can provide a defined entry and invalidation point.
Understanding Liquidity and Stop Clusters
Liquidity is one of the most misunderstood concepts in retail Forex analysis. Traders frequently hear phrases such as “liquidity sweep” or “stop hunt” and assume that every movement beyond a previous high or low is deliberate manipulation.
The more useful interpretation is structural rather than conspiratorial.
Orders naturally accumulate around obvious reference points. Previous swing highs, previous swing lows, psychological price levels and well-defined consolidation boundaries can attract significant trading interest because many market participants are watching the same locations.
These areas can therefore become important decision zones.
For example, imagine EUR/USD repeatedly tests a resistance level but fails to close convincingly above it. A later candle moves above the previous high before quickly returning below the resistance zone.
That movement can provide valuable information:
- Buy-side liquidity above the previous high may have been activated.
- The breakout failed to attract sustained continuation.
- Sellers may have regained short-term control.
- The failed breakout becomes a potential structural reference point.
However, traders should not automatically assume that every liquidity event creates a reversal. The market still needs confirmation.
A move above a previous high followed by sustained acceptance at higher prices is very different from a brief move above the high followed by a rapid rejection.
In other words, the reaction after a liquidity event can be more informative than the liquidity event itself.
Why Forex Breakouts Fail
Breakout trading is attractive because traders want to participate when price leaves consolidation. Yet breakouts are also among the easiest setups to misinterpret.
A genuine breakout generally involves more than a single candle crossing a horizontal level.
Useful confirmation factors can include:
- Expansion in trading range compared with recent candles.
- A decisive close beyond the structural boundary.
- Follow-through after the initial breakout.
- Volatility expansion rather than an isolated price spike.
- A successful retest of the broken level.
- Alignment with broader market structure.
A trader who enters simply because price briefly crossed resistance is effectively trading the event rather than the structure.
This distinction becomes particularly important around major economic releases. Volatility can expand rapidly, spreads can change and price can move through several technical levels within seconds.
A breakout under these conditions may represent genuine repricing, temporary order imbalance or a violent two-sided liquidity event.
Using Volatility to Improve Trade Selection
Direction tells traders where price is moving. Volatility tells them how aggressively price is moving.
This distinction is essential because the same strategy can behave very differently under low- and high-volatility conditions.
Average True Range, commonly known as ATR, is one of the simplest tools for monitoring volatility. Rather than predicting direction, ATR measures the magnitude of recent price movement.
When ATR rises, the market is generally experiencing larger average ranges. When ATR contracts, price is moving through a quieter environment.
| Volatility Condition | Potential Trading Implication |
|---|---|
| Low volatility | Breakouts may require patience because price can remain compressed for extended periods. |
| Rising volatility | Expansion trades may become more attractive if structural confirmation is present. |
| Extreme volatility | Stops and position size may need greater consideration because price ranges are expanding rapidly. |
| Falling volatility after expansion | Market may be entering consolidation or a new equilibrium phase. |
The key is not to treat high ATR as bullish or bearish. High volatility can accompany either direction.
Instead, volatility should be used as a position-sizing and trade-selection variable.
For example, a breakout that occurs after several hours of compression may carry a different statistical profile from a breakout that occurs after an already extended directional move.
The chart pattern may look similar, but the underlying volatility regime is different.
The Multi-Timeframe Structure Framework
A robust Forex analysis process can be divided into three questions.
Question 1: What Is the Higher-Timeframe Structure?
Begin with the daily or four-hour chart. Identify major swing highs, swing lows and important consolidation zones. Determine whether price is trending or ranging.
Question 2: What Is Happening Inside That Structure?
Move down to the one-hour or thirty-minute timeframe. Determine whether price is continuing the primary trend, correcting against it or compressing before a potential expansion.
Question 3: What Is the Execution Trigger?
Finally, use a lower timeframe to define the trade. The trigger could be a structural break, confirmed rejection, breakout-retest or momentum expansion.
This hierarchy prevents a common mistake: allowing a five-minute signal to completely override a much larger market structure.
It also helps traders distinguish between a genuine structural change and ordinary market noise.
Combining Momentum With Structure
Momentum indicators become considerably more useful when they are interpreted in context.
Consider RSI. An RSI reading above 70 is often described as “overbought,” while a reading below 30 is described as “oversold.” But strong markets can remain overbought or oversold for significant periods.
Therefore, the better question is not simply whether RSI is high or low.
The better questions are:
- Is momentum expanding or contracting?
- Is momentum confirming the structural trend?
- Is price making a new high while momentum weakens?
- Is a momentum shift occurring near a major structural level?
- Is the market trending or ranging?
A momentum divergence near major resistance can be more informative than the same divergence in the middle of a strong trend.
This is the broader principle: indicators become more valuable when they answer a structural question.
Risk Management Through Structural Invalidation
Risk management should not be an afterthought added after the entry is selected. It should influence whether the trade is taken in the first place.
One of the cleanest methods is structural invalidation.
Instead of deciding that a stop-loss should simply be a fixed number of pips away, the trader asks:
“At what price would my original market thesis no longer make sense?”
For a bullish structural setup, invalidation may occur beneath a significant swing low. For a bearish setup, it may occur above a meaningful swing high.
This creates a logical connection between analysis and risk.
| Approach | Strength | Potential Weakness |
|---|---|---|
| Fixed-pip stop | Simple and consistent. | May ignore changing market volatility. |
| ATR-based stop | Adapts to volatility. | Does not necessarily represent structural invalidation. |
| Structure-based stop | Directly tied to the trade thesis. | Stop distance can vary substantially. |
| Hybrid approach | Combines structure and volatility considerations. | Requires more disciplined position sizing. |
The critical principle is position sizing. If the logical structural stop is wider, the position size may need to become smaller so that the amount of capital at risk remains controlled.
This is where many technically sophisticated traders still make mistakes. Correct market analysis cannot compensate for excessive exposure.
Execution: Turning Analysis Into a Trade
Excellent analysis does not automatically produce excellent execution.
A trader can correctly identify the broader trend and still lose money by entering too early, using excessive leverage or repeatedly trading during low-quality conditions.
A professional execution process should answer five questions before entry:
- What is the structural thesis?
- What is the trigger?
- Where is the invalidation point?
- What is the expected reward relative to the risk?
- What market condition would make the setup unattractive?
This process transforms a vague market opinion into a testable trading hypothesis.
Where Algorithmic Execution Fits In
The same principles of structure, volatility and disciplined execution can also be translated into automated trading systems. Instead of manually watching every breakout, an algorithm can be programmed to monitor predefined conditions, place orders according to specific rules and manage open positions systematically.
For traders interested in how an automated XAUUSD approach can combine predefined execution rules, volatility measurements, order management and exposure controls, the GoldPulse PRO features provide a practical example of how technical trading concepts can be converted into systematic execution.
Automation, however, does not eliminate market risk. It simply converts a predefined methodology into executable rules. Strategy quality, broker conditions, position sizing and risk controls remain essential.
A Professional Forex Analysis Framework
The following framework can be used before analysing almost any major currency pair.
| Step | Analysis Question |
|---|---|
| 1. Structure | Is the market trending, ranging or transitioning? |
| 2. Key Levels | Where are the most important swing highs, lows and consolidation boundaries? |
| 3. Liquidity | Where are obvious clusters of orders likely to exist? |
| 4. Volatility | Is the market compressed, expanding or experiencing extreme movement? |
| 5. Momentum | Does momentum confirm or contradict the structural picture? |
| 6. Trigger | What specific price behaviour would justify an entry? |
| 7. Invalidation | What price movement would prove the thesis wrong? |
| 8. Position Size | Does the position size remain appropriate for the structural stop? |
| 9. Execution | Can the trade realistically be executed under current conditions? |
| 10. Review | Was the trade taken according to the original process? |
This framework is deliberately simple. Complexity does not automatically improve analysis. In fact, adding too many indicators can create conflicting signals and make the decision process less consistent.
A trader who uses five indicators should still be able to explain the trade without mentioning any of them. If the structural reasoning disappears when the indicators are removed, the analysis may be too dependent on signals rather than market behaviour.
Common Structural Analysis Mistakes
1. Treating Every Breakout as Genuine
Price crossing a level is not enough. Traders should distinguish between an initial penetration and sustained acceptance beyond the level.
2. Ignoring Higher-Timeframe Context
A lower-timeframe reversal can simply be a correction within a larger trend. Context matters.
3. Using Indicators Without Price Context
An oscillator reading has different implications in a strong trend compared with a sideways market.
4. Moving Stops Because the Trade Is Losing
If the original structural thesis has failed, increasing risk rarely repairs the analysis.
5. Confusing Volatility With Direction
A large candle tells you that price moved aggressively. It does not automatically tell you which direction will dominate next.
6. Overtrading During Noise
Not every market condition offers a high-quality opportunity. Sometimes the best technical decision is to wait.
7. Optimizing for Entry Instead of Risk
Traders can spend hours attempting to improve an entry by a few pips while ignoring position size, stop placement and overall exposure.
8. Treating Historical Patterns as Guarantees
A setup that performed well historically can still fail in live markets. Historical testing can provide evidence, but it does not remove uncertainty.
Further Reading & References
The following resources provide additional information for readers who want to study Forex market structure, market activity and technical analysis in greater depth.
Conclusion
Successful Forex analysis does not require traders to predict every market movement. The more durable approach is to understand how price behaves around structure, liquidity, volatility and important decision zones.
Market structure provides the framework. Liquidity identifies areas where price may encounter significant order activity. Volatility explains how aggressively the market is moving. Momentum can help confirm whether pressure is strengthening or weakening. Risk management determines whether an incorrect idea remains survivable.
The combination is considerably more powerful than relying on a single indicator.
Most importantly, professional analysis is built around conditional thinking. Instead of saying “EUR/USD will rise,” a structured trader might say: “If price holds this support zone and establishes a higher low, bullish continuation becomes more probable. If that structure fails, the thesis is invalidated.”
That small change in thinking creates a major difference in trading discipline.
The same philosophy applies to gold and other highly liquid markets. XAUUSD, for example, can experience rapid structural changes and significant volatility expansion. Traders studying gold can follow dedicated XAUUSD technical analysis and market research to see how structural concepts are applied to an actively traded instrument.
The market does not owe traders certainty. It provides information through price movement. The trader’s job is to interpret that information, define risk, wait for confirmation and execute only when the potential opportunity justifies the exposure.
In an enormous and continuously evolving market, the edge is rarely found in predicting every candle. It is more often found in having a repeatable process for understanding what price is doing, what could happen next, and exactly what would prove the analysis wrong.
Risk Disclosure: Forex and leveraged trading carry significant risk of loss and may not be suitable for all investors. Leverage can amplify both gains and losses. Technical analysis cannot guarantee future market performance. Automated trading systems also involve execution, market and technology risks. Past performance is not indicative of future results. Readers should consider their financial circumstances, experience and risk tolerance before making any trading decision.