NIFTY 50 Trader’s Edge: Live Technical Action & Support Matrix
01 Options Strike Chain & Futures Execution Matrix
Options Strike Strategy
| At-The-Money (ATM): | 22,750 Strike |
| Bullish Breakout (CE): | 22,800 / 22,900 CE |
| Bearish Breakdown (PE): | 22,700 / 22,600 PE |
| Range Strategy: | Breakout Confirmation Required |
| Primary Focus: | Wait for Signal Alignment |
Futures Scalper Blueprint
| Trigger Corridor: | 22,559 – 23,175 |
| Long Trigger: | 1H close > 23,175 |
| Short Trigger: | 1H close < 22,559 |
| Recommended Stop: | 30–35 Index Points |
| Execution Method: | Breakout Retest Entry |
Open interest and price action around 22,739.20 reflect cautious positioning with a WAIT signal status on higher frames and SELL bias on lower timeframes. Wait for a decisive confirmation before deploying fresh directional positions.
02 1H Macro Structural View
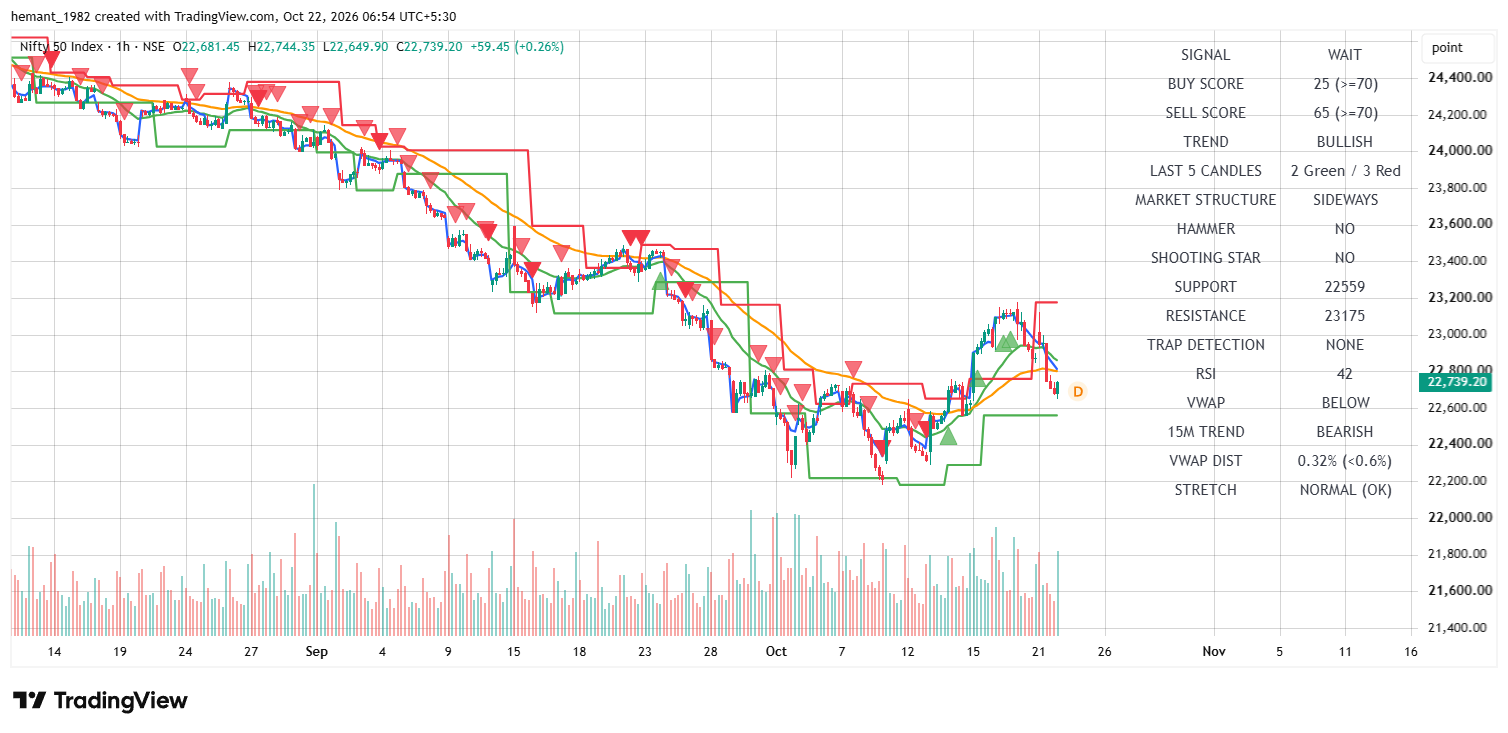
| Timeframe Metric | Institutional Value | Technical & Strategy Interpretation |
|---|---|---|
| 1H Trend / Signal | BULLISH / WAIT | Macro bullish trend; Buy Score 25 vs Sell Score 65. |
| RSI (14) Momentum | 42 (Neutral-Bearish) | Pullback momentum testing below midpoint. |
| Candle Structure | 2 Green / 3 Red | Market Structure SIDEWAYS; Hammer: NO, Shooting Star: NO. |
| VWAP & Stretch | BELOW (0.32%) | VWAP Distance <0.6% indicates NORMAL (OK) price stretch. |
| Major Resistance | 23,175 | Heavy Call Writing — Macro target ceiling. |
| Major Support | 22,559 | Heavy Put Writing — Institutional defense floor. |
The 1-hour macro view displays a resilient bullish structural baseline with RSI at 42 and price sustaining near key support thresholds.
03 15M Tactical Setup
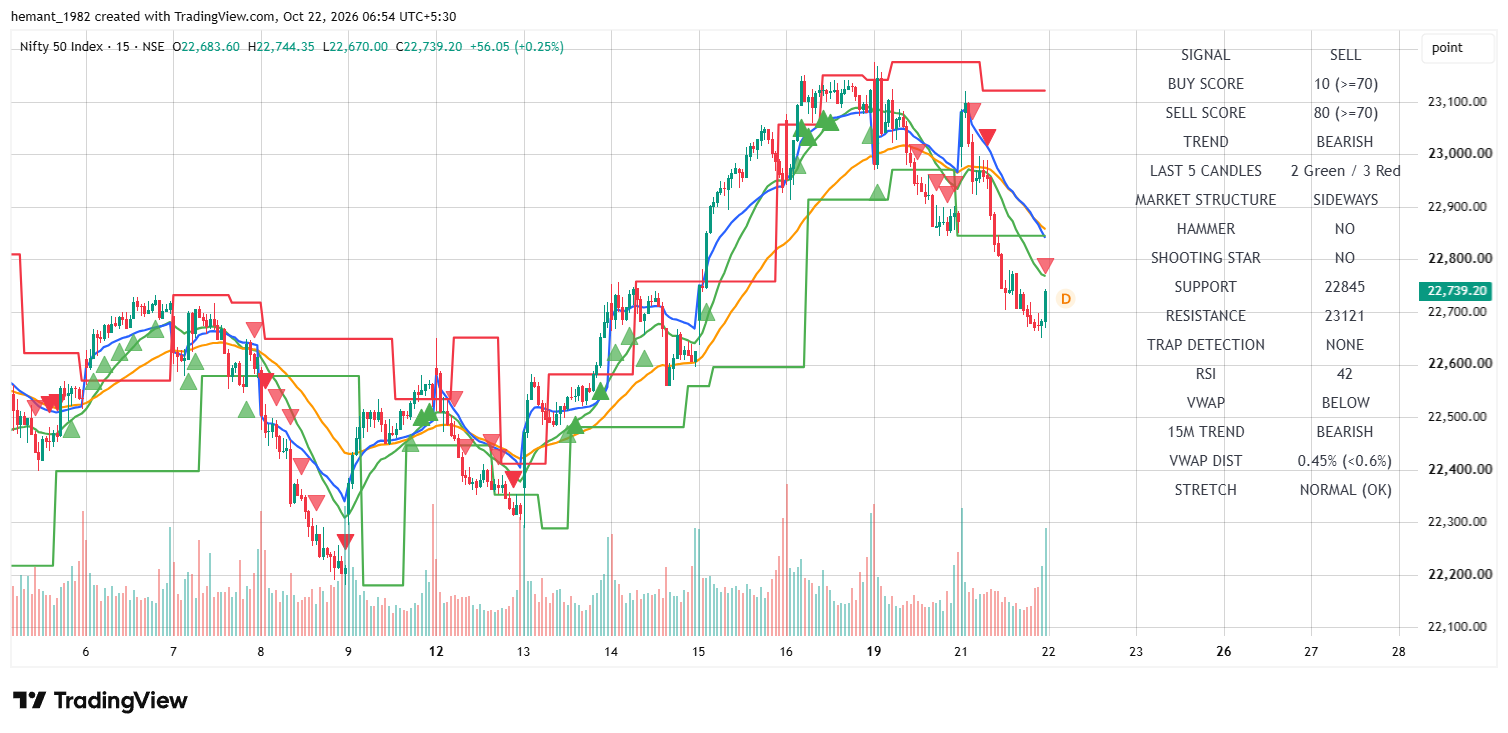
| Timeframe Metric | Institutional Value | Technical & Strategy Interpretation |
|---|---|---|
| 15M Trend / Signal | BEARISH / SELL | Bearish trend active; Buy Score 10 vs Sell Score 80. |
| RSI (14) Momentum | 42 (Neutral-Bearish) | Holding weak momentum below mid-line 50 level. |
| Candle Structure | 2 Green / 3 Red | Market Structure SIDEWAYS; Hammer: NO, Shooting Star: NO. |
| VWAP & Stretch | BELOW (0.45%) | Trading below VWAP; marked NORMAL (OK). |
| Tactical Resistance | 23,121 | Key upside breakout barrier. |
| Tactical Support | 22,845 | Intermediate swing defense floor. |
The 15-minute chart exhibits short-term downward pressure below resistance while testing localized swing supports.
04 5M Execution & Scalper View
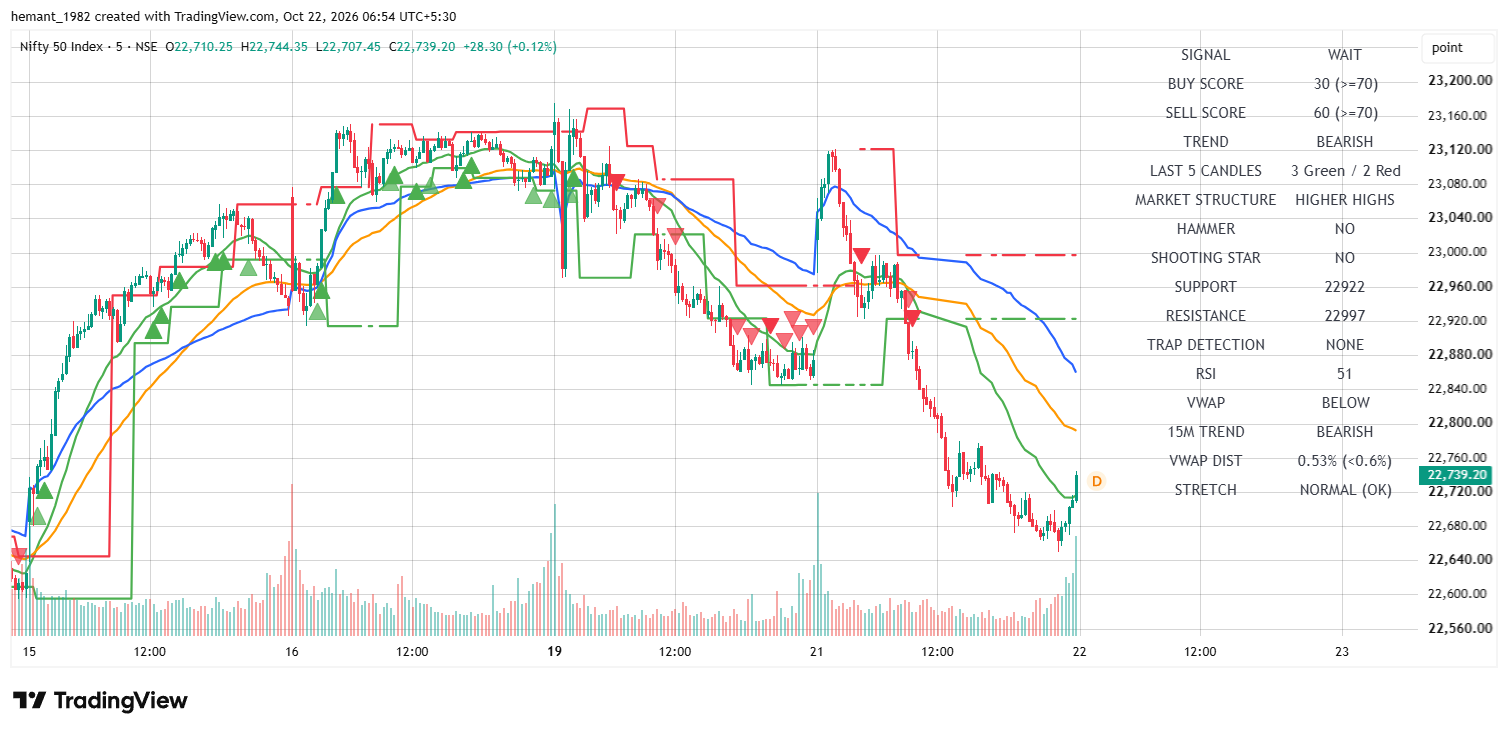
| Timeframe Metric | Institutional Value | Technical & Strategy Interpretation |
|---|---|---|
| 5M Trend / Signal | BEARISH / WAIT | Bearish trend; Buy Score 30 vs Sell Score 60. |
| RSI (14) Momentum | 51 (Neutral) | Balanced momentum near neutral midpoint. |
| Candle Structure | 3 Green / 2 Red | Market Structure HIGHER HIGHS; Hammer: NO, Shooting Star: NO. |
| VWAP & Stretch | BELOW (0.53%) | Trading below VWAP; stretch marked NORMAL (OK). |
| Scalp Resistance | 22,997 | Immediate scalp breakout trigger. |
| Scalp Support | 22,922 | Immediate scalp support floor. |
The 5-minute chart highlights short-term intraday dynamics between support at 22,922 and resistance at 22,997. Watch for breakout confirmation.
05 Institutional Price Map & Strike Confluence
| Price Level | Role & Timeframe | Derivatives & Strike Implications |
|---|---|---|
| 23,175 | 1H Macro Resistance | Heavy CE Writing Zone — Major supply ceiling. |
| 22,997 | 5M Scalp Resistance | Immediate intraday trigger barrier. |
| 22,922 | 5M Scalp Support Floor | Immediate intraday defense floor. |
| 22,845 | 15M Tactical Support Floor | Intermediate swing defense zone. |
| 22,739.20 | Current Spot Benchmark | Live session pivot level. |
| 22,559 | 1H Macro Support Floor | Heavy PE Writing Wall — Major institutional floor. |
06 Professional Market Outlook
Multi-timeframe technical structure reflects a corrective phase centered around 22,739.20, with key support and resistance zones providing clear reaction parameters.