NIFTY 50 Technical Analysis: Key Levels, Trend Structure and Trading Strategy
The NIFTY 50 is showing a market structure that deserves more attention than a simple “bullish or bearish” label. The latest 15-minute chart shows a pronounced decline from the 23,400–23,500 region, several failed recovery attempts, a sharp sell-off into the 22,200–22,300 area, and a subsequent rebound toward 22,535. For traders, the important question is not simply whether NIFTY has bounced. The more useful question is whether the bounce can develop into a genuine change in structure or whether it remains a recovery inside a larger downtrend.
This NIFTY 50 technical analysis uses the chart from October 5, 2026 as a practical case study. The purpose is to explain how traders can identify trend direction, support and resistance, failed breakdowns, breakout confirmation, pullback entries, risk levels and invalidation points without relying on a single indicator or making an unconditional market prediction.
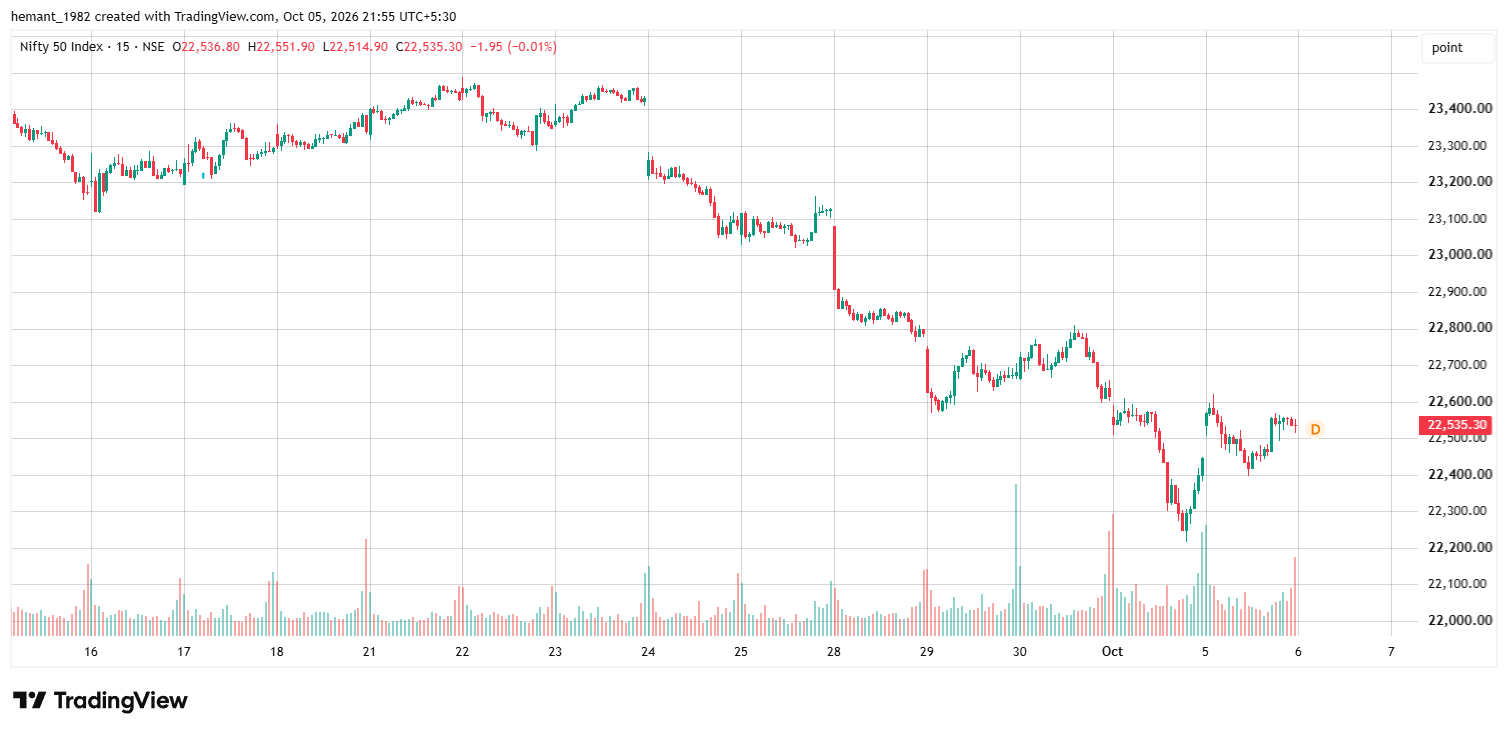
Chart: NIFTY 50, 15-minute timeframe, TradingView snapshot dated October 5, 2026. Levels discussed below are analytical reference zones and should be verified against live market prices before trading.
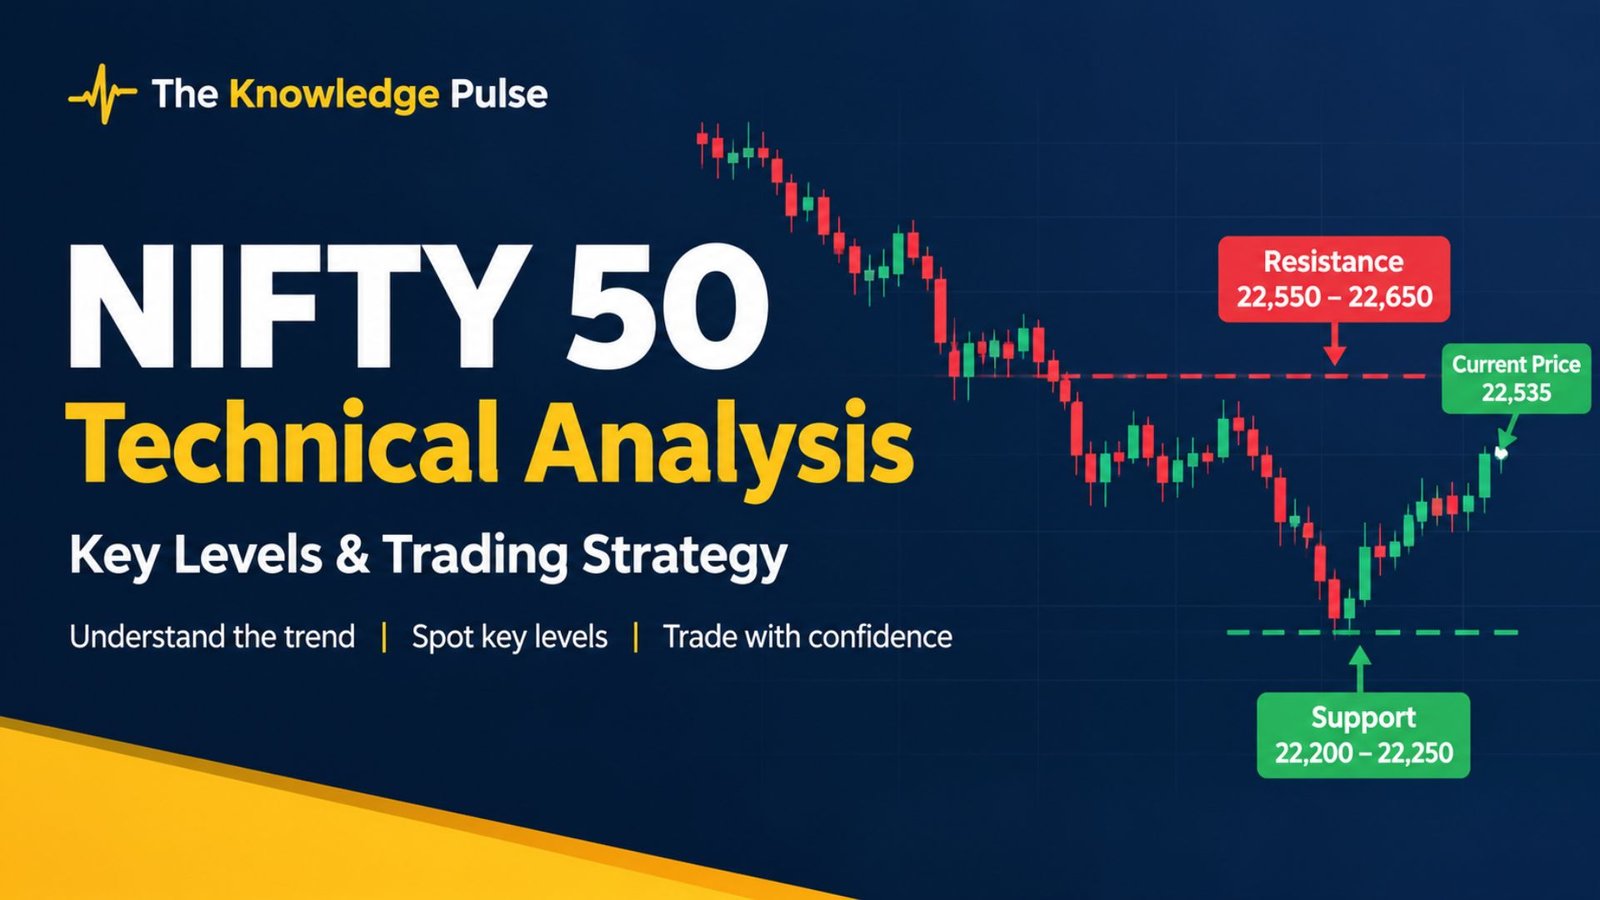
The supplied 15-minute chart shows NIFTY around 22,535, with the recent recovery developing after a sharp decline toward approximately 22,200–22,250. Immediate overhead pressure appears around 22,550–22,650, while the broader structure remains weaker until higher resistance zones are reclaimed.
- What the Current NIFTY Chart Is Really Saying
- Understanding the NIFTY Trend Structure
- Important NIFTY Support Levels
- Important NIFTY Resistance Levels
- Is the Current Bounce a Reversal?
- How to Trade a Bullish Breakout
- How to Trade a Bearish Breakdown
- The Pullback Strategy for NIFTY Traders
- NIFTY Intraday Trading Framework
- NIFTY Options Traders: What Matters Most
- Common Mistakes Traders Should Avoid
- Bullish, Bearish and Range-Bound Scenarios
- Risk Management and Position Sizing
- NIFTY Trading Checklist
- Final Takeaway
1. What the Current NIFTY Chart Is Really Saying
At first glance, the latest chart can appear encouraging because NIFTY has recovered from the recent low and moved back toward 22,535. However, traders should distinguish between a bounce and a trend reversal.
The 15-minute chart shows a clear deterioration in price structure. Earlier in the displayed period, NIFTY was trading above 23,300 and moved toward the 23,400–23,500 region. That advance eventually failed. Once the market began producing lower highs and lower lows, sellers gained control.
The subsequent decline was not a single straight-line move. There were several temporary recoveries, but each recovery struggled to establish a new sustained high. This is important because a bearish market can produce surprisingly strong green candles and still remain bearish.
The most significant feature on the right side of the chart is the sharp fall toward the 22,200–22,300 area followed by a recovery. That zone therefore becomes important for future price action. If buyers repeatedly defend it, the area can develop into a meaningful short-term base. If the zone breaks decisively, the recent rebound loses much of its technical significance.
2. Understanding the NIFTY Trend Structure
Price structure is often more useful than trying to predict every candle. A basic bullish structure consists of higher highs and higher lows. A bearish structure consists of lower highs and lower lows.
On the supplied chart, the market moved from the upper 23,000s into the 22,000s while repeatedly failing to recover previous swing highs. This tells traders that selling pressure has been persistent.
The recovery from the recent low is therefore best treated as a test. The market needs to demonstrate whether buyers can push through nearby resistance and establish a higher low before the bullish case becomes considerably stronger.
Why lower highs matter
Suppose NIFTY rallies from 22,300 to 22,600 but then falls back to 22,400. If the next rally fails near 22,550–22,600, traders have evidence that sellers are still defending the same region.
Conversely, if price breaks through that zone, consolidates above it, and then rallies again, the market begins to demonstrate a different structure. That is much more useful information than simply seeing one large green candle.
Why the 15-minute timeframe matters
A 15-minute chart can be particularly useful for intraday traders because it filters some of the noise visible on very short timeframes while still providing enough information for active trading.
Traders using 5-minute entries can therefore use the 15-minute chart for directional context and the 5-minute chart for execution. This creates a simple hierarchy:
- 15-minute chart: identify the dominant intraday structure.
- 5-minute chart: wait for an entry setup.
- Price level: define the invalidation point.
- Position size: adjust according to the stop distance.
3. Important NIFTY Support Levels
Support should not always be treated as a single exact number. In real trading, support is often better understood as a zone. Price can temporarily move below a level before recovering, especially during volatile sessions.
| Zone | Role | What Traders Should Watch |
|---|---|---|
| 22,450–22,500 | Near-term support | Whether the recent rebound can maintain higher intraday lows. |
| 22,300–22,400 | Secondary support | Failure here would weaken the current recovery structure. |
| 22,200–22,250 | Major recent swing-support zone | A decisive breakdown would increase bearish pressure. |
| 22,000 | Psychological support | Important if the recent low fails and selling accelerates. |
The 22,200–22,250 region deserves particular attention because it represents the area from which the latest recovery emerged. If buyers continue to defend this zone, it can become the foundation for a larger rebound.
But traders should avoid assuming that support will automatically hold. A support level becomes more useful when price action confirms it. Repeated rejection, increasing buying volume and a subsequent higher low can provide stronger evidence than simply touching a number.
4. Important NIFTY Resistance Levels
Resistance is currently just as important as support because the market is attempting to recover from a substantial decline.
| Zone | Importance | Possible Interpretation |
|---|---|---|
| 22,550–22,650 | Immediate resistance | A decisive break could extend the current recovery. |
| 22,700–22,800 | Major short-term hurdle | Previous price action suggests substantial supply in this region. |
| 22,900–23,000 | Structural resistance | Reclaiming this area would materially improve the short-term trend. |
| 23,200+ | Higher resistance | A much stronger recovery would be required to reach this region. |
The first test for buyers is therefore relatively close to the current market price. This creates an important situation for traders: NIFTY does not need to travel hundreds of points before the next technical decision. The market is already approaching a region where sellers previously became active.
5. Is the Current Bounce a Reversal?
This is probably the most important question on the chart.
A sharp rebound after a large decline can happen for several reasons. Short sellers may book profits, oversold conditions may attract buyers, or new buyers may genuinely believe that valuations and price levels have become attractive.
But the first bounce does not tell us which explanation is correct.
A practical way to evaluate the situation is to divide the reversal question into three stages.
Stage 1: Recovery from support
NIFTY has already demonstrated this part of the process by recovering from the 22,200–22,250 region.
Stage 2: Break of immediate resistance
Buyers now need to demonstrate that the market can move through the 22,550–22,650 region rather than repeatedly failing there.
Stage 3: Higher low after breakout
This is often overlooked. A breakout becomes more convincing if the market subsequently pulls back but holds above the previous resistance zone. In other words, resistance becomes support.
A structure such as breakout → pullback → successful retest → new high is generally more informative than a single large candle.
6. How to Trade a Bullish Breakout
A bullish breakout setup should be based on confirmation rather than anticipation. Many traders buy simply because NIFTY approaches resistance. That can be dangerous because resistance is exactly where selling pressure may return.
For the current chart, traders can monitor the 22,550–22,650 region as the first decision area.
A more disciplined breakout framework could look like this:
- Price approaches the resistance zone.
- A 15-minute candle closes above the zone.
- The breakout is not immediately rejected.
- The next pullback holds above or near the breakout area.
- A new intraday high confirms continuation.
Traders using the 5-minute chart can then look for a smaller consolidation or higher low after the breakout. This can provide a more controlled entry than chasing the first large candle.
What invalidates the bullish breakout?
A rapid move above resistance followed by a strong close back below it can represent a false breakout. If that happens, traders should avoid treating the original breakout level as automatically bullish.
7. How to Trade a Bearish Breakdown
The bearish setup is equally important because the broader chart structure remains under pressure.
If NIFTY loses the 22,450–22,500 region and subsequently moves toward the 22,300–22,250 area, traders should watch the reaction carefully.
A decisive breakdown through the recent swing-support zone would be more significant than a temporary intraday dip.
A practical bearish confirmation sequence is:
- Price breaks a clearly identified support zone.
- The 15-minute candle closes below the zone.
- A recovery attempt fails below the broken support.
- Price creates a new lower high.
- Sellers resume control.
This approach can help traders avoid shorting every small red candle. In a volatile index, waiting for a failed retest can often provide a cleaner risk reference.
8. The Pullback Strategy for NIFTY Traders
One of the most useful concepts for index trading is the difference between chasing price and trading a pullback.
Suppose NIFTY breaks above 22,650 and immediately jumps 70 or 80 points. A trader who enters after the large move may have a poor risk-to-reward profile.
Instead, the trader can wait for price to return toward the breakout zone.
If the previous resistance around 22,600–22,650 now behaves as support and the 5-minute structure produces a higher low, the trader has a clearly defined technical reference point.
The same principle works in reverse for bearish trades. After a breakdown, a weak recovery toward the broken support can become a potential short setup if sellers regain control.
9. NIFTY Intraday Trading Framework
A trader does not need ten indicators to analyze NIFTY. A simple multi-timeframe framework can be more effective.
Step 1: Start with the 15-minute chart
Identify the current structure. Is NIFTY making higher highs, lower highs, or moving sideways?
Step 2: Mark only the important zones
Avoid drawing twenty horizontal lines. Focus on the previous day’s high and low, major swing points, psychological numbers and the strongest recent support/resistance zones.
Step 3: Move to the 5-minute chart
Use the shorter timeframe for execution only after the higher timeframe provides directional context.
Step 4: Wait for confirmation
Confirmation can come through a breakout and retest, rejection candle, higher low, lower high or failure of a support/resistance zone.
Step 5: Define risk before entering
The stop-loss should not be decided after entering a position. The invalidation point should be identified before the trade.
10. NIFTY Options Traders: What Matters Most
NIFTY options traders need to be especially careful about confusing a correct directional view with a profitable options trade.
NIFTY can move in the expected direction and an option buyer can still lose money because of time decay, volatility changes, strike selection and entry timing.
This becomes particularly important when traders buy far-out-of-the-money options simply because they are cheap.
For example, if NIFTY is trading near 22,535, an option with a distant strike may require a much larger move before it responds strongly enough to compensate for premium decay and other factors.
Traders should therefore focus first on the underlying index structure and only then choose an appropriate options strategy.
SEBI’s published material repeatedly highlights that derivatives are leveraged instruments and can produce disproportionately large gains as well as losses. :contentReference[oaicite:2]{index=2}
11. Common Mistakes NIFTY Traders Should Avoid
1. Buying because the market has already fallen
A falling market can remain weak for much longer than expected. “It has already fallen a lot” is not a technical entry signal.
2. Shorting directly into major support
A bearish trend does not mean every price is a good short entry. If NIFTY reaches major support, waiting for a breakdown or failed bounce can produce a more logical setup.
3. Chasing a large candle
Large candles often attract emotional entries. By the time a trader enters, the best part of the move may already be over.
4. Using too many indicators
RSI, MACD, moving averages, VWAP, Supertrend and other indicators can be useful, but adding more indicators does not necessarily create better decisions.
Price structure, support, resistance and risk management should remain the foundation.
5. Moving the stop-loss after entry
A trader who repeatedly moves a stop farther away can turn a manageable loss into a large one. The original trade thesis should determine the invalidation point.
6. Trying to recover losses immediately
Revenge trading is particularly dangerous in NIFTY because the index can generate multiple fast moves during a single session. After a loss, reducing activity can be more productive than increasing it.
12. Three Possible NIFTY Scenarios
Scenario A: Bullish continuation
NIFTY holds above the recent recovery base, breaks the 22,550–22,650 resistance region and then successfully retests it. If price subsequently moves through the 22,700–22,800 region, the short-term recovery becomes more convincing.
The key is not merely crossing the number. The market should demonstrate acceptance above it.
Scenario B: Bearish rejection
NIFTY fails near immediate resistance, begins forming lower highs and then loses 22,450–22,500. A move toward the recent low would then become possible.
If the 22,200–22,250 region fails decisively, the market structure would become considerably more bearish.
Scenario C: Sideways consolidation
This is often ignored by traders, but it may be the most frustrating scenario. NIFTY could remain between approximately 22,400 and 22,650 for several sessions while buyers and sellers fight for control.
In such an environment, breakout traders may experience repeated false signals. Waiting for a confirmed range breakout can therefore be preferable to trading every small movement.
| Market Condition | What to Watch | Trader’s Priority |
|---|---|---|
| Bullish breakout | 22,550–22,650 reclaimed and held | Look for continuation/pullback setups |
| Bearish rejection | Resistance rejection followed by lower low | Watch support breakdowns |
| Range | Repeated rejection at both boundaries | Reduce overtrading and wait for expansion |
13. Risk Management and Position Sizing
Technical analysis identifies potential setups. Risk management determines whether a trader can survive when those setups fail.
A simple formula can help:
For example, if a trader decides that the maximum acceptable loss on one trade is ₹1,000 and the technical stop is 20 points away, the trader should size the position so that a 20-point adverse move does not exceed the predetermined risk.
The exact quantity depends on the instrument, contract specifications and the trader’s account. The important principle is that the stop should determine the position size, not the other way around.
Traders should also remember that derivatives involve leverage. SEBI’s published risk disclosures emphasize that derivatives can create disproportionate gains and losses compared with the capital used. :contentReference[oaicite:3]{index=3}
14. NIFTY Trading Checklist
Before taking an intraday NIFTY trade, a trader can ask the following questions:
- What is the 15-minute trend?
- Is the market making higher highs or lower highs?
- Where are the nearest major support and resistance zones?
- Is price currently in the middle of a range?
- Am I buying directly into resistance?
- Am I shorting directly into support?
- Has a breakout actually closed beyond the level?
- Has the breakout been retested?
- Where is my trade invalidated?
- How much money can I afford to lose on this trade?
- Is the position size consistent with that risk?
- Am I entering because of a setup or because I am afraid of missing the move?
This checklist may look simple, but simplicity is often an advantage in fast markets. The goal is to make the decision process repeatable rather than emotional.
15. How to Use the NIFTY Chart With Other Market Information
Technical analysis should not be isolated from the broader market environment. NIFTY traders should also monitor major scheduled events, global equity markets, crude oil, bond yields, the Indian rupee, institutional flows and important domestic economic announcements.
The October 5 market move is a good example. Current market reports attributed the rebound partly to improved global sentiment, softer US employment data and a decline in crude prices, while attention was also turning toward the upcoming RBI policy decision. :contentReference[oaicite:4]{index=4}
This is why a trader should not interpret a chart in isolation. A technically attractive breakout can fail if a major economic announcement suddenly changes market sentiment.
For official index information and methodology, traders can refer to Nifty Indices . The official methodology describes NIFTY 50 as a float-adjusted market-capitalization weighted index representing major segments of India’s equity market. :contentReference[oaicite:5]{index=5}
For exchange-related information and market data, traders can also use the National Stock Exchange of India .
For investor education and regulatory information concerning derivatives and securities markets, the Securities and Exchange Board of India is an important primary source.
Traders should also monitor the Reserve Bank of India for monetary-policy announcements and other developments that can affect interest rates, liquidity, currency markets and investor sentiment.
16. Why NIFTY Traders Should Think in Zones, Not Exact Numbers
One of the biggest improvements a trader can make is moving away from the idea that every market level must be exact.
Suppose resistance is identified around 22,600. It would be unrealistic to assume that every seller will appear at exactly 22,600. One trader may sell at 22,570, another at 22,620 and another at 22,650.
This creates a resistance zone rather than a perfect horizontal line.
The same principle applies to support. A temporary move below support does not automatically mean that the level has failed. The closing price, speed of recovery, volume and subsequent structure all matter.
Thinking in zones helps traders avoid unnecessary stop-outs caused by small intraday fluctuations.
17. The Most Important Signal on This Chart
If only one concept from this entire analysis is remembered, it should be this: watch what happens after the market reaches an important level.
A price level by itself does not tell you whether buyers or sellers will win. The reaction does.
If NIFTY reaches 22,650 and sellers immediately push it back toward 22,500, that tells us something.
If NIFTY breaks 22,650, holds above it and later uses 22,650 as support, that tells us something very different.
Likewise, if the market reaches 22,250 and produces a strong rejection followed by higher lows, buyers are demonstrating demand. If price breaks 22,250, retests it from below and fails, sellers are demonstrating control.
This is the essence of price-action analysis.
18. Final Takeaway: What NIFTY Traders Should Watch Next
The October 5, 2026 NIFTY chart presents a market at an important decision point. The index has recovered from the approximately 22,200–22,250 region, but the broader 15-minute structure still reflects the damage caused by the preceding decline.
The immediate question is whether buyers can reclaim the 22,550–22,650 region and convert that resistance into support. Above that, the 22,700–22,800 area becomes important. A sustained move through progressively higher resistance would improve the short-term bullish structure.
On the other hand, failure near resistance followed by a loss of 22,450–22,500 would keep the market vulnerable. The 22,300–22,400 region would then become an important intermediate area, while the 22,200–22,250 zone remains the major recent swing-support area visible on the supplied chart.
The most disciplined approach is therefore not to predict that NIFTY must rise or must fall. Instead, traders can prepare for both outcomes and allow price action to determine which scenario is developing.
Above resistance + successful retest = bullish structure improves.
Below support + failed retest = bearish structure strengthens.
Between major levels = patience may be the best trade.
That approach is especially valuable for intraday traders because the objective is not to predict every movement. The objective is to identify a high-quality setup, define the invalidation point, control the position size and participate only when the market provides sufficient confirmation.
NIFTY will continue to produce new highs, lows, breakouts and false breakouts. The levels discussed in this article are therefore best viewed as a framework for interpreting price action rather than permanent predictions. Traders should always verify live prices, contract specifications, market conditions and relevant news before taking a position.
- Nifty Indices — official NIFTY index information and methodology.
- NSE India — official exchange information and market resources.
- SEBI — regulatory and investor-education resources, including derivatives risk information.
- Reserve Bank of India — monetary-policy and financial-market information.