NIFTY 50 is trading at 22,517.00 (-0.16% on 1H / +0.09% on 15M / +0.17% on 5M) showing mixed multi-timeframe alignment with BEARISH 1H and 15M trends against a BULLISH 5M scalping posture.
The market remains in a sideways structure across intervals with all timeframe signals on WAIT. Intraday momentum reflects balance, with RSI hovering at 41 (1H), 49 (15M), and 54 (5M). With primary intraday support marked at 22,454 / 22,372 and overhead resistance capping near 22,573 / 22,593, traders should wait for a clear directional signal alignment outside the key trigger range before committing to directional entries.
Price action around 22,517.00 shows tight range-bound behavior across short timeframes. With Buy Score at 30–45 and Sell Score at 35–60, both buyers and sellers lack a clear dominant signal. Wait for a decisive breakout above 22,593 or a breakdown below 22,454 before taking fresh directional trades.
02 1H Macro Structural View
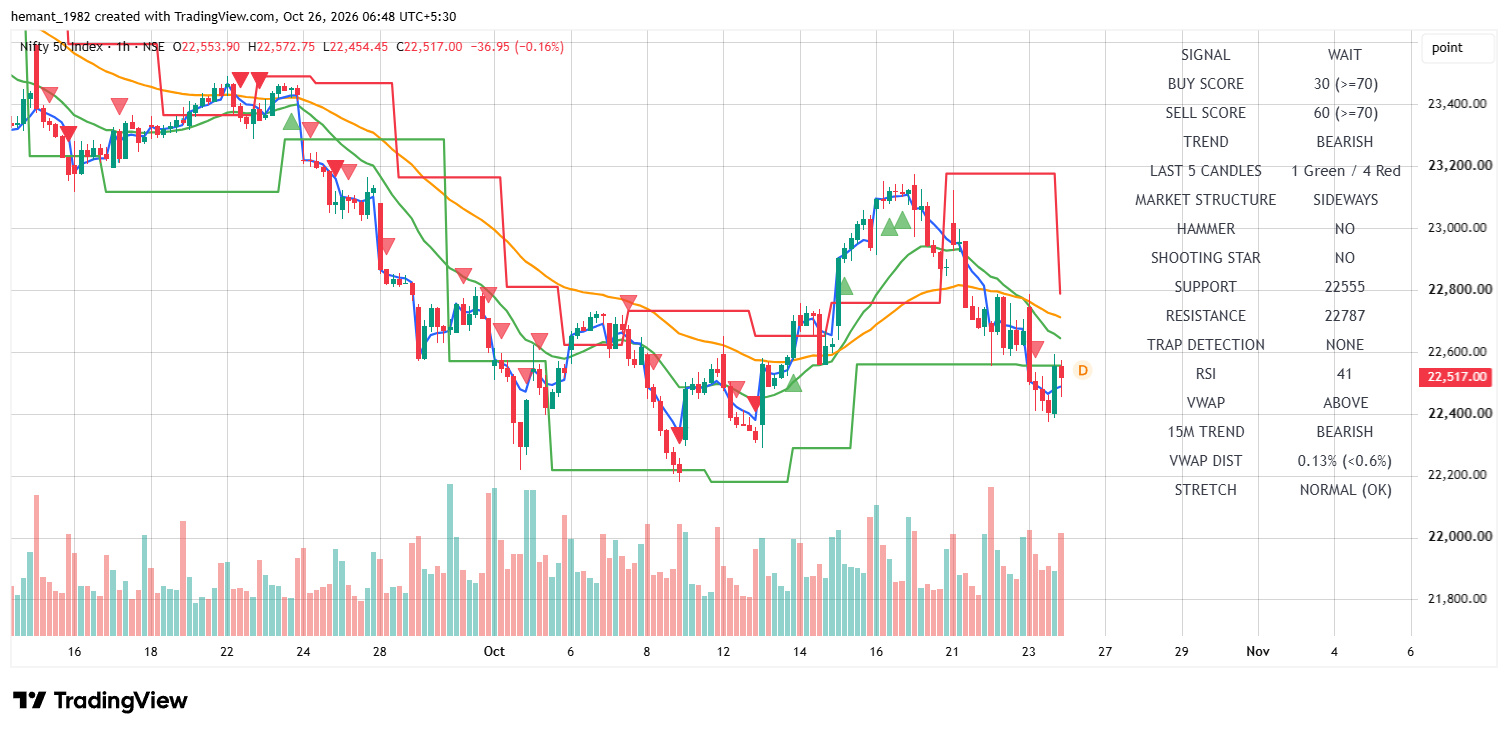
NIFTY 50 1H Chart — Bearish macro structure holding below resistance at 22,787, with support near 22,555 and spot currently at 22,517.00.
Timeframe Metric
Institutional Value
Technical & Strategy Interpretation
1H Trend / Signal
BEARISH / WAIT
Macro trend is bearish; Buy Score 30 vs Sell Score 60.
RSI (14) Momentum
41 (Neutral-Bearish)
Consolidating below mid-50 level within steady macro structure.
Candle Structure
1 Green / 4 Red
Market Structure SIDEWAYS; Hammer: NO, Shooting Star: NO.
VWAP & Stretch
ABOVE (0.13%)
VWAP Distance <0.6% indicates NORMAL (OK) price stretch.
Major Resistance
22,787
Heavy Call Writing — Macro resistance target.
Major Support
22,555
Heavy Put Writing — Institutional defense floor.
The 1-hour chart displays macro consolidation, testing levels near the 22,555 support base. RSI at 41 suggests mild selling pressure while VWAP distance remains tight at 0.13%, reflecting normal price distribution.
03 15M Tactical Setup
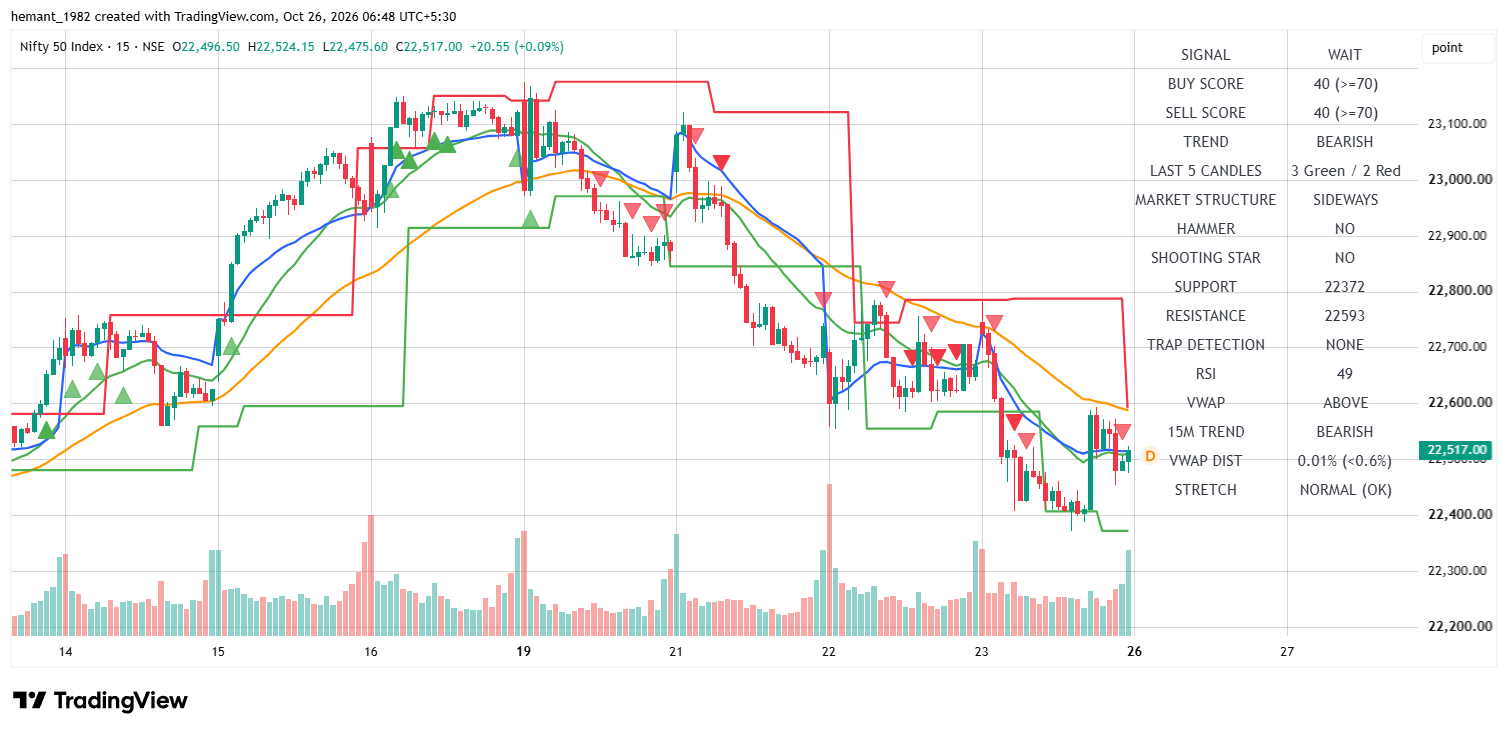
NIFTY 50 15M Chart — Tactical consolidation trading between support at 22,372 and resistance at 22,593.
Timeframe Metric
Institutional Value
Technical & Strategy Interpretation
15M Trend / Signal
BEARISH / WAIT
Tactical trend is bearish; Buy Score 40 vs Sell Score 40.
RSI (14) Momentum
49 (Neutral)
Trading near neutral midpoint, reflecting range-bound balance.
Candle Structure
3 Green / 2 Red
Market Structure SIDEWAYS; Trap Detection: NONE.
VWAP & Stretch
ABOVE (0.01%)
Trading near VWAP; marked NORMAL (OK).
Tactical Resistance
22,593
Upper supply band and breakout level.
Tactical Support
22,372
Intermediate tactical support floor.
The 15-minute tactical structure highlights price action recovering near VWAP to 22,517.00. Momentum is balanced with RSI at 49, with key bounds established at 22,372 on the downside and 22,593 on the upside.
04 5M Execution & Scalper View
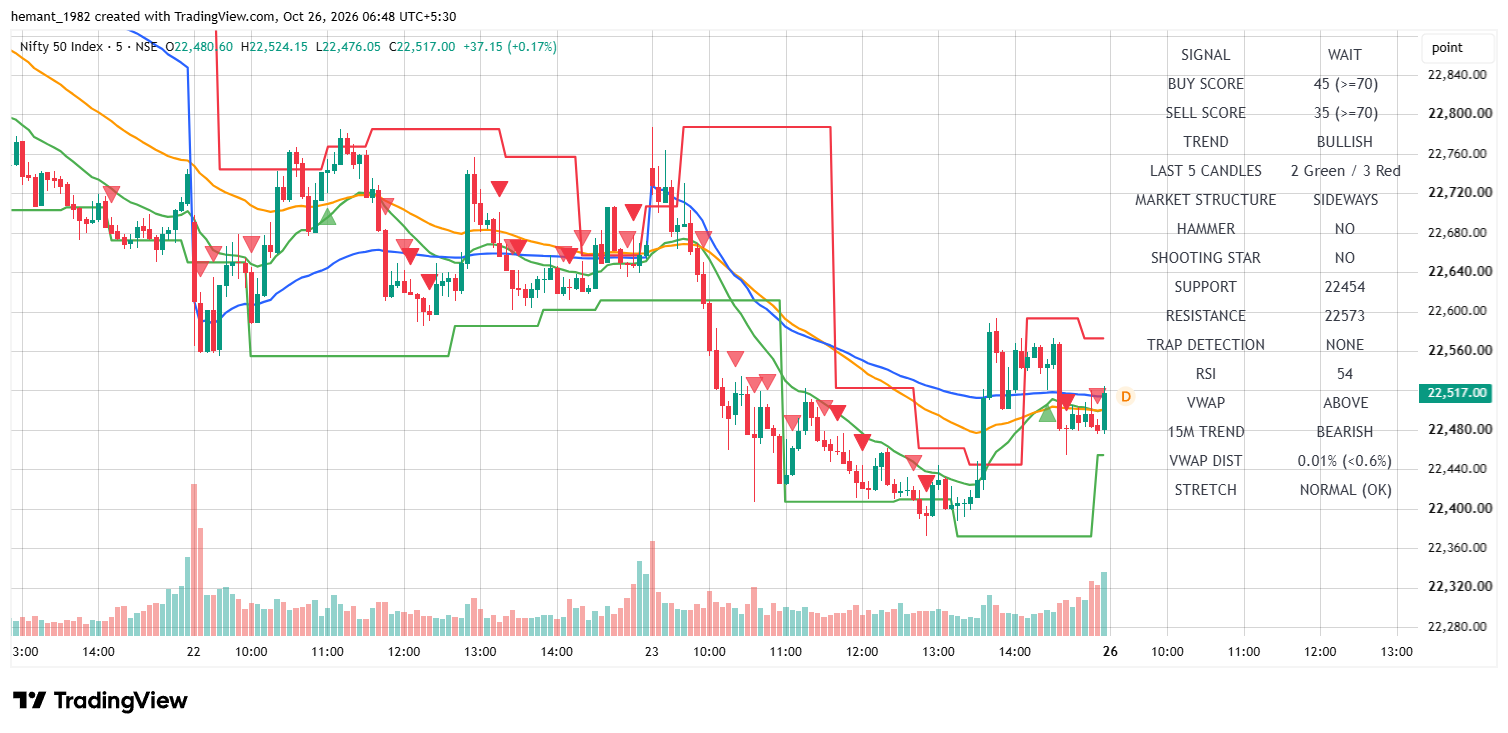
NIFTY 50 5M Chart — Intraday scalping setup showing immediate support at 22,454 and resistance at 22,573.
Timeframe Metric
Institutional Value
Technical & Strategy Interpretation
5M Trend / Signal
BULLISH / WAIT
Intraday trend is bullish; Buy Score 45 vs Sell Score 35.
RSI (14) Momentum
54 (Neutral-Bullish)
Slight positive momentum attempt above 50 level.
Candle Structure
2 Green / 3 Red
Market Structure SIDEWAYS; Hammer: NO, Shooting Star: NO.
VWAP & Stretch
ABOVE (0.01%)
Holding above VWAP; stretch marked NORMAL (OK).
Scalp Resistance
22,573
Immediate intraday scalp resistance barrier.
Scalp Support
22,454
Immediate intraday scalp support floor.
The 5-minute scalping grid indicates price moving above VWAP with RSI at 54. The immediate trading range is bounded between support at 22,454 and resistance at 22,573.
05 Institutional Price Map & Strike Confluence
Price Level
Role & Timeframe
Derivatives & Strike Implications
22,787
1H Macro Resistance Ceiling
Heavy CE Writing Wall — Macro supply cap.
22,593
15M Tactical Resistance
Tactical upside target level.
22,573
5M Intraday Scalp Resistance
Immediate breakout trigger ceiling.
22,517.00
Current Spot Benchmark
Live session equilibrium pivot.
22,454
5M Intraday Scalp Support Floor
Immediate breakdown trigger level.
22,372
15M Tactical Support Floor
Intermediate support zone.
22,555
1H Macro Support Floor
Heavy PE Writing Wall — Major institutional floor.
06 Professional Market Outlook
NIFTY 50 is experiencing sideways consolidation around 22,517.00. While the 1H macro trend maintains a bearish stance below resistance, lower timeframes reflect shifting momentum, creating a balanced WAIT environment.
Bottom Line Execution Plan
Mixed Multi-Timeframe Alignment with Sideways Structure. Exercise Patience.
Maintain a neutral posture until price breaks either above intraday resistance at 22,593 or below key support at 22,454. Wait for clear signal score confirmation before opening new positions.
Educational Disclaimer: This technical market report is published strictly for educational purposes. Futures, options, and derivatives trading involve significant risk of financial loss. Content does not constitute investment advice or direct buy/sell recommendations. Always consult a certified financial advisor before trading derivatives.
Every retail trader knows the gut punch of a five-figure loss. Learn how Nifty expiry traps trigger revenge trading, why theta decay punishes emotional entries, and how mastering the discipline of stepping away saves your trading account.
Discover whether the XAU/USD correction is a bear trap or the start of a major crash. Dive into central bank buying, Fed policy, and key support levels
Tired of getting wicked out of your gold trades during Fed rate decisions? Learn how institutional algorithms hunt stop-losses and discover a bulletproof 3-step framework to trade XAU/USD safely during FOMC volatility
Discover the latest Nifty 50 technical report for 23 October 2026. Review spot benchmarks at 22,667.25, 1H/15M/5M trend confluences, institutional support zones, and actionable options strategies.
Live technical action and expiry strike matrix update for NIFTY 50 as of October 14, 2026. Review multi-timeframe Confluence, support and resistance levels, and derivatives strategy