Trading XAU/USD During FOMC: The 3-Step Strategy to Avoid Fakeouts
Are you tired of getting wicked out of your gold trades when the Federal Reserve announces its rate decision? You are definitely not alone.
FOMC decision days can produce some of the fastest and most difficult price movements in XAU/USD. Gold can surge through a technical level, reverse sharply, and then establish a completely different direction as traders digest the rate decision, projections, and Federal Reserve commentary.
That is why the first price spike can be dangerous to chase. What looks like a clean breakout may instead become a temporary move that quickly returns inside the previous trading range.
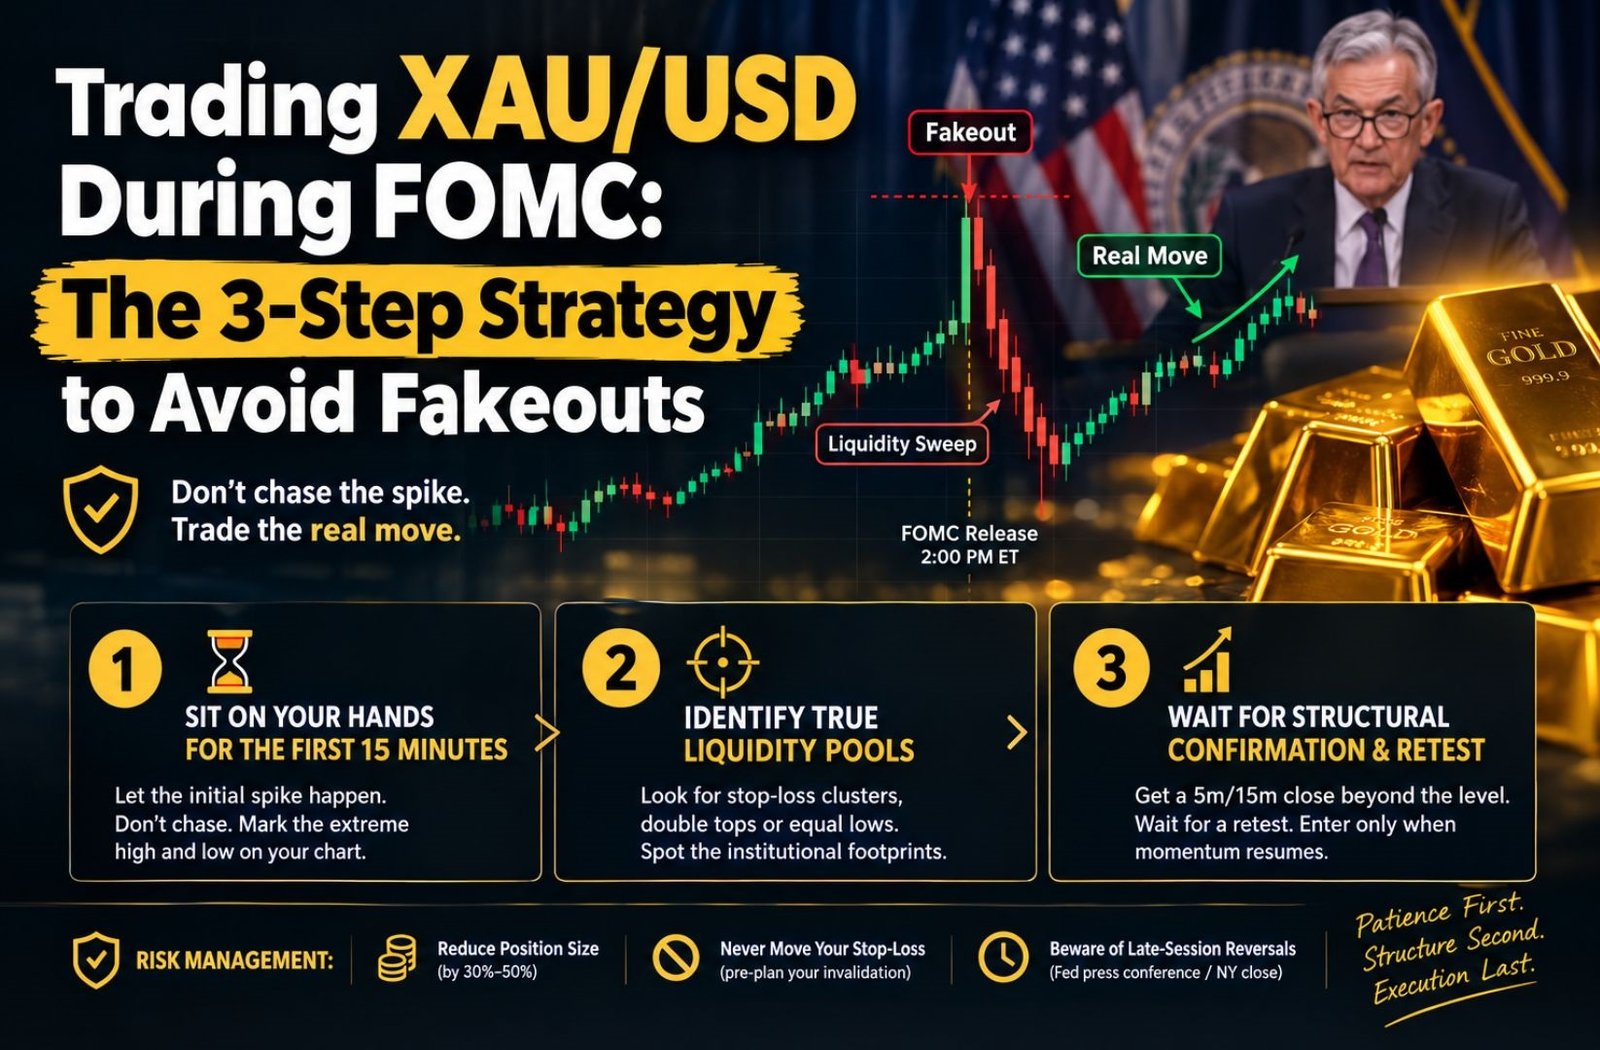
Do not assume the first FOMC price spike is the move you should trade. Instead, let the initial volatility develop, mark the reaction high and low, identify important liquidity areas, and wait for structural confirmation and a retest before considering an entry.
Inside This Story
Why XAU/USD Can Fake Out on FOMC Days
Gold is highly sensitive to changes in US interest-rate expectations, the US dollar, and Treasury yields. When the Federal Reserve releases its monetary-policy decision, markets can rapidly reprice those expectations.
On an FOMC decision day, several forces can hit the market almost simultaneously:
- Algorithmic systems can react extremely quickly to the statement and changes in market expectations.
- Short-term traders may enter as soon as familiar support or resistance levels break.
- Stop-losses and pending orders around obvious highs and lows can add to the initial burst of volatility.
- The market can then reassess the decision as traders study the statement, projections, and subsequent Federal Reserve commentary.
The Anatomy of a Fed Trap
Imagine gold has spent several hours trading inside a relatively narrow range before an FOMC decision.
At the announcement, XAU/USD suddenly pushes above the day’s high. Breakout traders may interpret that move as confirmation and enter long positions. But if price quickly falls back below the broken level, the breakout has failed.
The important point is that you do not need to know whether a move was deliberately engineered to hunt stops. You can simply observe what price actually did: break the level, reject it, and return inside the range.
For example, the $2,350 level below is purely illustrative. The same concept can be applied to whatever support, resistance, previous high, or previous low is actually visible on your chart on the day you trade.
| Phase | What Price May Show | What a Trader Should Watch |
|---|---|---|
| Initial reaction | Large candle, fast breakout, or sharp rejection | Reaction high, reaction low, spread and volatility |
| Early reassessment | Price stalls, retraces, or tests the breakout area | Whether the broken level holds or fails |
| Follow-through | Sustained move or complete reversal | Market structure, retest and momentum |
The 3-Step Strategy to Trade FOMC More Carefully
The objective is not to predict the Fed or guess the first candle. The objective is to create a repeatable process that keeps you out of the most chaotic part of the reaction and gives price time to reveal whether a level is actually holding.
Step 1: Sit on Your Hands for the First 15 Minutes
The first 15 minutes after a major FOMC release can be extremely difficult to interpret. A practical approach is to use this period primarily for observation rather than automatically entering a trade.
Let the initial reaction develop. Mark the high and low created during the early volatility on your 5-minute chart. Also mark important pre-release levels such as the day’s high, day’s low, previous session high or low, and obvious range boundaries.
Step 2: Identify True Liquidity Pools, Not Just Retail Lines
Once the initial volatility begins to settle, examine the areas around obvious highs and lows.
Examples include:
- Previous session highs and lows
- Equal or closely matched highs
- Equal or closely matched lows
- Clearly defined intraday range boundaries
- Major support and resistance levels
If gold pushes beyond one of these areas and then closes back inside the previous range, that is useful information. It may indicate a failed breakout or liquidity sweep, but the next step is still confirmation rather than an immediate assumption that price must reverse.
Step 3: Wait for Structural Confirmation and Retest
This is where the strategy becomes more selective. Instead of entering simply because a level was swept, wait for price to demonstrate what it wants to do next.
- Wait for a 5-minute or 15-minute candle to close beyond a meaningful structural level.
- Look for a pullback or retest of that level where practical.
- Check whether price holds the level instead of immediately falling back through it.
- Enter only when momentum resumes and your predefined risk level makes sense.
Risk Management Rules Every Gold Trader Must Follow
FOMC trading is not only a directional problem. Execution itself becomes more difficult when volatility rises. Spreads can widen, candles can expand rapidly, and slippage can affect the actual entry or exit price.
- Reduce Position Risk: If your normal position size feels too large for the expected news volatility, reduce it. The exact reduction should depend on your account size, stop distance, broker conditions, and predefined risk limit.
- Never Move Your Stop-Loss to Justify a Trade: Decide where the trade is invalid before entering. If price reaches that point, accept the loss rather than widening the stop because the Fed is still speaking.
- Account for Spread and Slippage: A technical setup can look perfect on the chart while the actual execution is materially worse during a news spike.
- Avoid Forcing a Trade: If the market remains chaotic after the initial reaction, there is no requirement to participate.
- Watch the Later Reaction: The market can continue repricing expectations during and after the Federal Reserve Chair’s press conference. A move that appears complete immediately after the statement can change later.
Trusted References
For primary information and macroeconomic context, these sources are useful:
- Federal Reserve — FOMC Meeting Calendars and Statements — official meeting schedules, policy statements and related Federal Reserve information.
- CME FedWatch Tool — market-implied probabilities and expectations for upcoming Federal Reserve rate decisions.
- World Gold Council — Market Research and Analysis — research and analysis covering gold-market fundamentals and macroeconomic drivers.
For traders who use automated XAU/USD tools, the same principles of news awareness, position sizing and execution risk should still apply. ForexDevice focuses on automated trading tools for the forex and gold markets.
Reviewed by The Knowledge Pulse Research Team
Disclosure: This article is for educational and informational purposes only and does not constitute financial or trading advice. Trading XAU/USD and leveraged derivatives carries a high level of risk. Market conditions, spreads and execution can change rapidly during major economic announcements.
Frequently Asked Questions
Why does XAU/USD move so violently during FOMC?
Gold is sensitive to changes in US interest-rate expectations, the US dollar and Treasury yields. When the Federal Reserve changes its policy outlook or communicates a different path for future rates, market participants can rapidly reprice those expectations, producing substantial XAU/USD volatility.
Should I hold open gold positions right through an FOMC release?
Holding an unhedged XAU/USD position through a major news release exposes the trade to unusually high volatility, wider spreads and possible slippage. Whether a trader chooses to remain exposed depends on their strategy and risk plan, but the execution risks should be understood before the announcement.
What is a liquidity sweep in gold trading?
A liquidity sweep is commonly used by price-action traders to describe a move through a previous high or low that is followed by rejection or a return back through the level. The pattern can help identify a failed breakout, but it does not by itself prove who caused the move or guarantee a reversal.
Is the first FOMC move always a fakeout?
No. The initial move can sometimes develop into the main directional move. That is why the strategy should not assume that every first spike must reverse. The purpose of waiting is to obtain additional price-action information before taking risk.
What timeframe should I use for this strategy?
A 5-minute chart can be useful for observing the initial reaction and identifying short-term structure. A 15-minute chart can provide additional context for larger levels and confirmation. The important point is to use a timeframe consistently rather than switching between charts simply to justify an entry.
Conclusion
Trading XAU/USD during FOMC does not require predicting the Federal Reserve’s next move or catching the first candle.
A more disciplined approach is to let the initial volatility develop, mark the important reaction levels, identify failed breakouts or liquidity sweeps, and then wait for structural confirmation and a retest before considering an entry.
Patience first. Structure second. Execution last.
That sequence will not eliminate losing trades, but it can help prevent impulsive entries during one of the most volatile periods in the gold market.