NIFTY 50 Trader’s Edge: Live Technical Action & Support Matrix
01 Options Strike Chain & Futures Execution Matrix
Options Strike Strategy
| At-The-Money (ATM): | 22,750 Strike |
| Bullish Momentum (CE): | 22,750 / 22,800 CE |
| Bearish Risk (PE): | 22,700 / 22,650 PE |
| Range Strategy: | Trend Continuation on Dips |
| Primary Focus: | Buy Signal Confluence (Score 80) |
Futures Scalper Blueprint
| Trigger Corridor: | 22,637 – 22,830 |
| Long Trigger: | Sustained Holding > VWAP (22,760) |
| Short Trigger: | 5M close < 22,637 |
| Recommended Stop: | 25–30 Index Points |
| Execution Method: | Pullback to VWAP / Breakout Target 22,830 |
Price action around 22,762.00 reflects clear bullish control on short-term charts. With Buy Score standing high at 80 (>=70 threshold) on both 5-minute and 15-minute timeframes, buyers are dominant above VWAP. Dips toward VWAP offer low-risk momentum entry points toward resistance at 22,830.
02 1H Macro Structural View
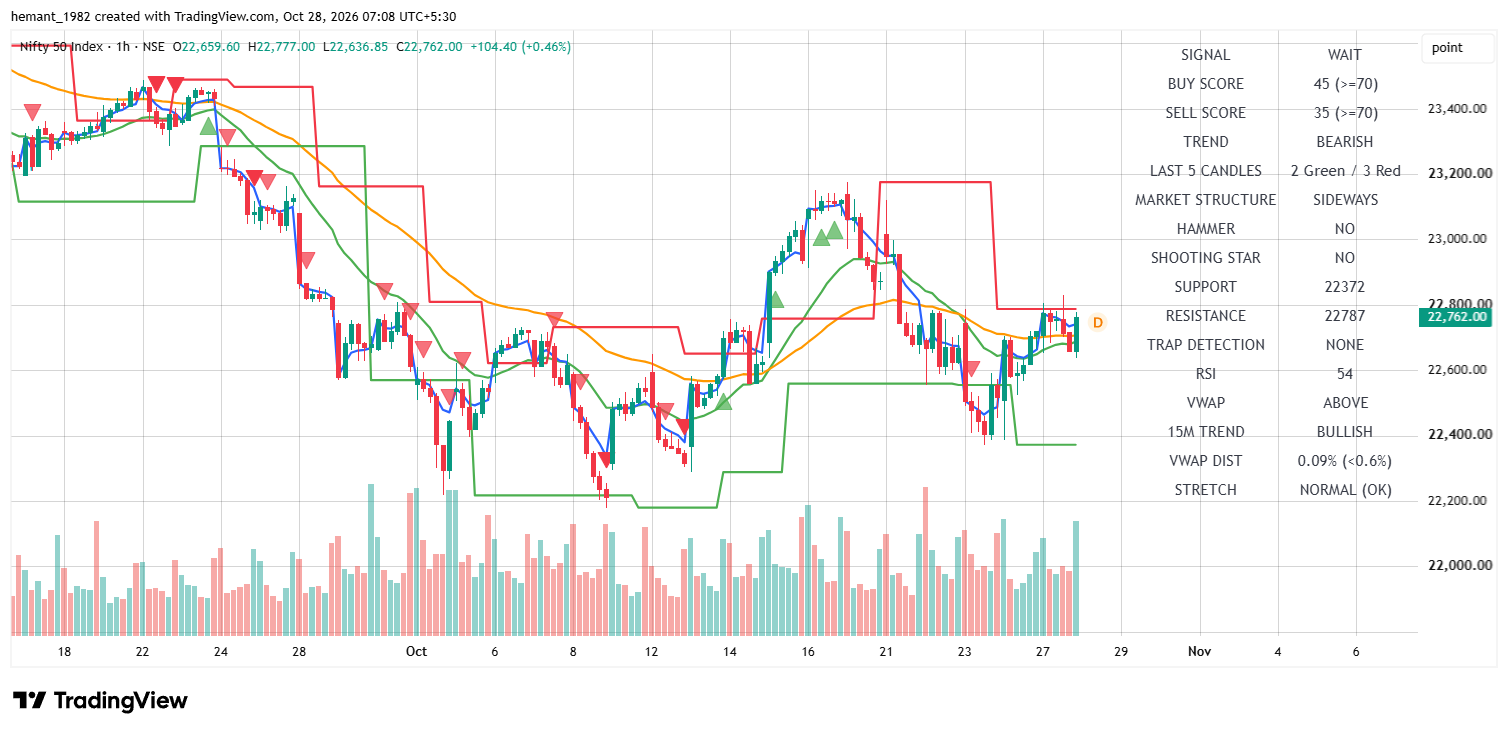
| Timeframe Metric | Institutional Value | Technical & Strategy Interpretation |
|---|---|---|
| 1H Trend / Signal | BEARISH / WAIT | Macro trend is bearish; Buy Score 45 vs Sell Score 35. |
| RSI (14) Momentum | 54 (Neutral-Bullish) | Recovering above mid-50 level within macro consolidation. |
| Candle Structure | 2 Green / 3 Red | Market Structure SIDEWAYS; Hammer: NO, Shooting Star: NO. |
| VWAP & Stretch | ABOVE (0.09%) | VWAP Distance <0.6% indicates NORMAL (OK) price stretch. |
| Major Resistance | 22,787 | Heavy Call Writing — Immediate macro resistance target. |
| Major Support | 22,372 | Heavy Put Writing — Key institutional defense floor. |
The 1-hour chart displays macro recovery following prior weakness, bringing spot to 22,762.00. While the broader trend is categorized as BEARISH, momentum is stabilizing with RSI at 54 and price holding above VWAP (+0.09% distance).
03 15M Tactical Setup
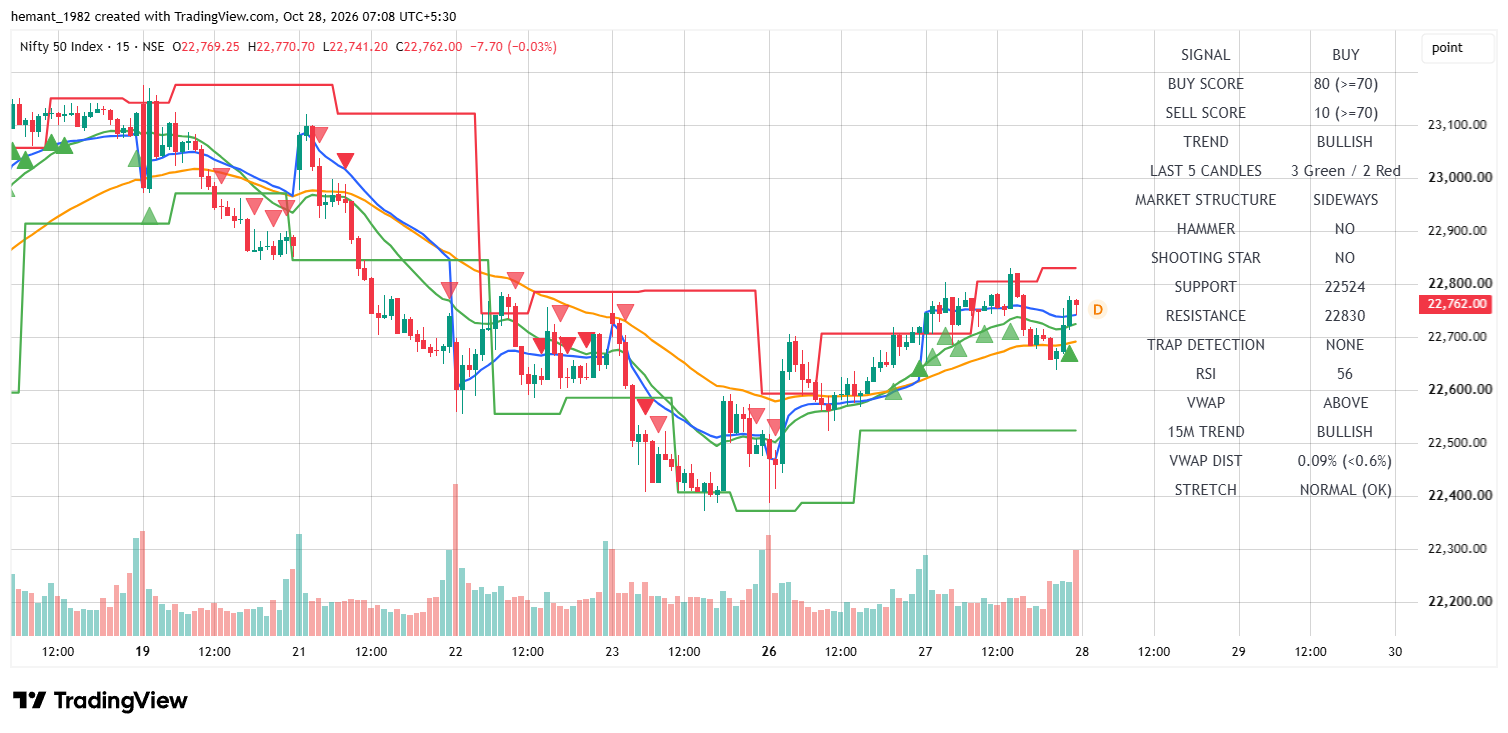
| Timeframe Metric | Institutional Value | Technical & Strategy Interpretation |
|---|---|---|
| 15M Trend / Signal | BULLISH / BUY | Tactical trend is bullish; Buy Score 80 vs Sell Score 10. |
| RSI (14) Momentum | 56 (Bullish) | Positive momentum continuation above mid-50 level. |
| Candle Structure | 3 Green / 2 Red | Market Structure SIDEWAYS; Trap Detection: NONE. |
| VWAP & Stretch | ABOVE (0.09%) | Trading soundly above VWAP; marked NORMAL (OK). |
| Tactical Resistance | 22,830 | Upper supply barrier and primary bullish target. |
| Tactical Support | 22,524 | Primary tactical support floor. |
The 15-minute tactical layout highlights sustained upside momentum, pushing spot to 22,762.00. The active BUY signal (Score 80) and solid RSI at 56 support higher targets toward the 22,830 resistance level.
04 5M Execution & Scalper View
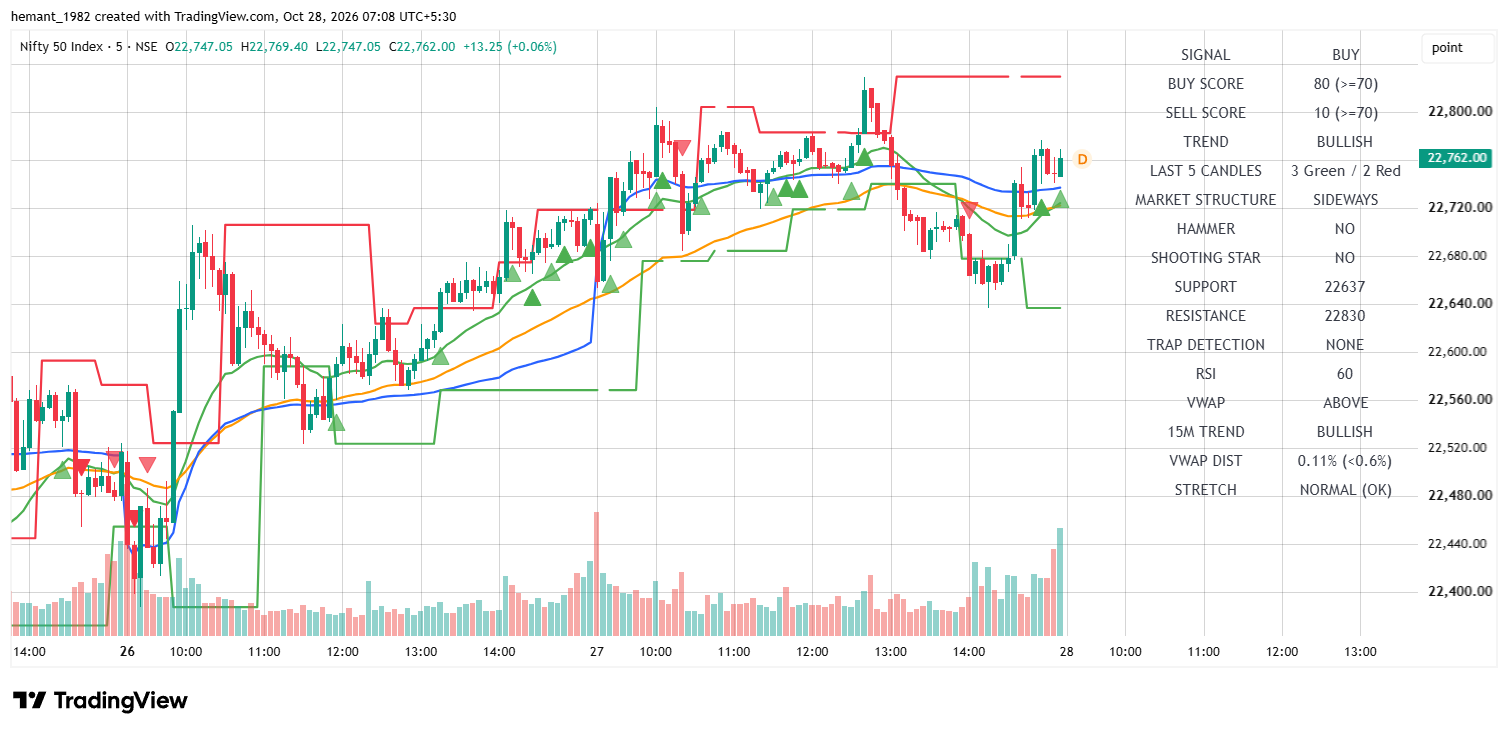
| Timeframe Metric | Institutional Value | Technical & Strategy Interpretation |
|---|---|---|
| 5M Trend / Signal | BULLISH / BUY | Intraday scalp trend is bullish; Buy Score 80 vs Sell Score 10. |
| RSI (14) Momentum | 60 (Bullish Expansion) | Strong intraday buying momentum holding above 60. |
| Candle Structure | 3 Green / 2 Red | Market Structure SIDEWAYS; Hammer: NO, Shooting Star: NO. |
| VWAP & Stretch | ABOVE (0.11%) | Firmly holding above VWAP; stretch marked NORMAL (OK). |
| Scalp Resistance | 22,830 | Immediate intraday scalp resistance target. |
| Scalp Support | 22,637 | Immediate intraday scalp support floor. |
The 5-minute scalping framework demonstrates strong buyers’ dominance with RSI expanding to 60. Maintaining position above VWAP (0.11% distance) confirms a favorable environment for scalping long setups toward 22,830.
05 Institutional Price Map & Strike Confluence
| Price Level | Role & Timeframe | Derivatives & Strike Implications |
|---|---|---|
| 22,830 | 15M / 5M Tactical & Scalp Resistance | Heavy CE Writing Wall — Primary intraday upside target. |
| 22,787 | 1H Macro Resistance | Intermediate supply hurdle for bulls. |
| 22,762.00 | Current Spot Benchmark | Live session equilibrium price. |
| 22,637 | 5M Intraday Scalp Support Floor | Immediate scalp defense floor. |
| 22,524 | 15M Tactical Support Floor | Key tactical buyer defense zone. |
| 22,372 | 1H Macro Support Floor | Heavy PE Writing Wall — Major institutional floor. |
06 Professional Market Outlook
NIFTY 50 presents a favorable intraday setup as short-term timeframes (5M and 15M) align with bullish momentum and a BUY signal rating of 80/10. Price remains firmly above VWAP, with RSI rising into the 56–60 range.