NIFTY 50 is trading at 22,719.20 on Expiry Day with strong intraday bullish momentum across lower timeframes (5M Buy Score: 90, 15M Buy Score: 105) holding above VWAP.
With today marking the joint Weekly & Monthly Expiry, lower timeframe technical structures display solid momentum (15M RSI: 65, 5M RSI: 64). Options positioning indicates major writing density capping resistance at 22,787[cite: 2], while primary support pins sit securely at 22,524–22,568[cite: 1, 3]. Traders should manage gamma risk dynamically around high-volume VWAP levels.
On Expiry Day, rapid theta decay mandates precise entry execution around key strike boundaries. Current spot price (22,719.20)[cite: 1, 2, 3] stays firmly above intraday VWAP, favoring long setups on minor pullbacks toward 22,568–22,600 while tracking potential gamma acceleration past 22,787[cite: 2].
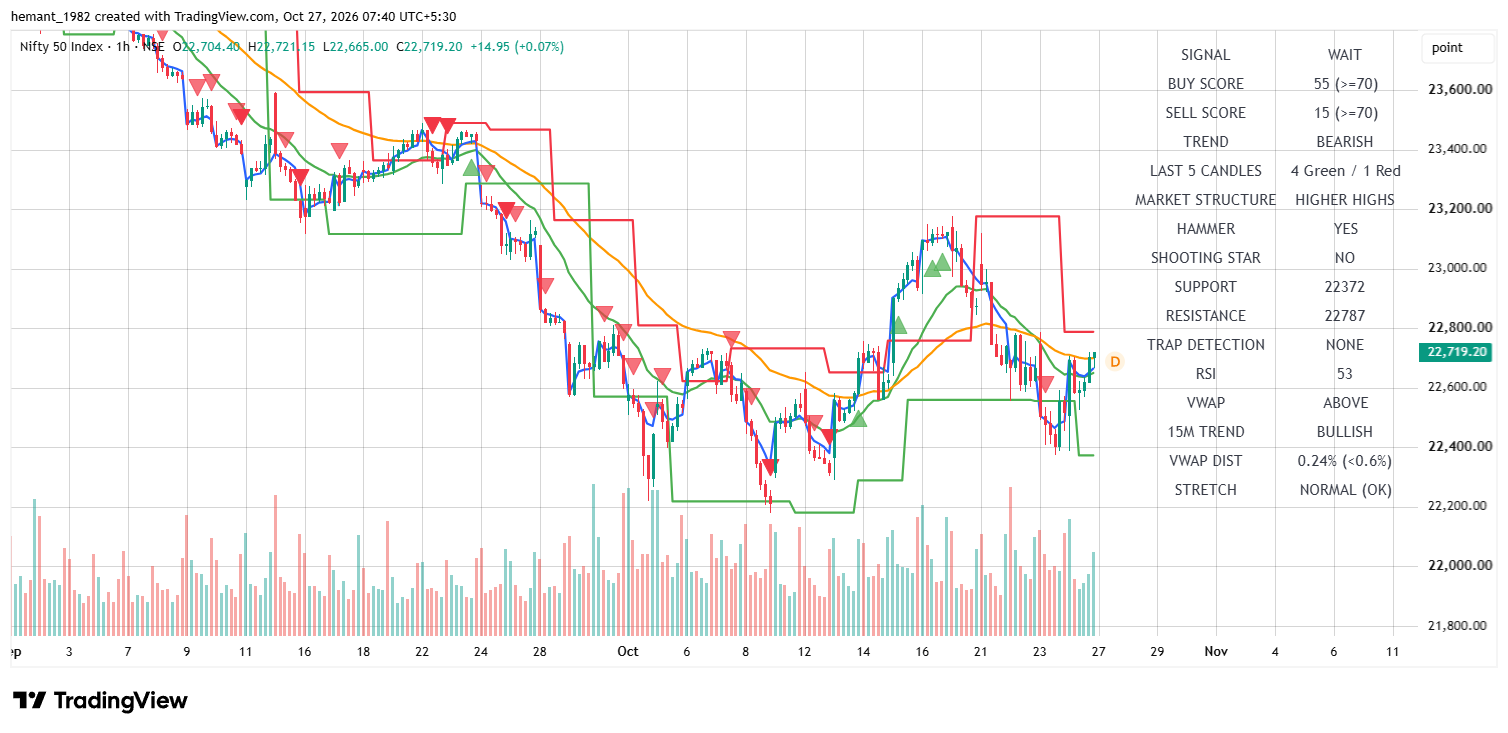
02 1H Macro Structural View
NIFTY 50 1H Chart — Steady structure holding above key support at 22,372, facing immediate expiry resistance at 22,787 with spot trading at 22,719.20[cite: 2].
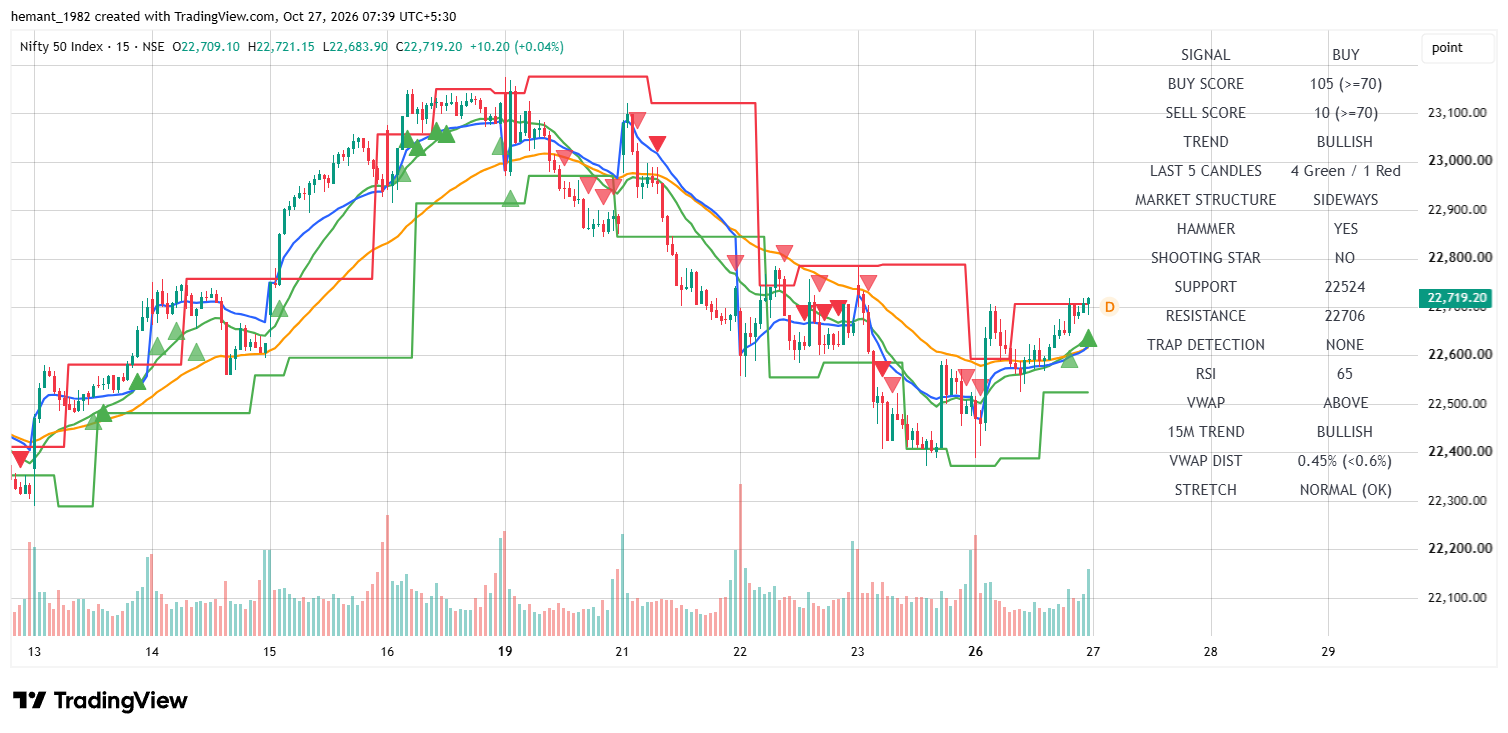
The 15-minute tactical chart confirms high buying conviction with a maximum Buy Score of 105[cite: 3]. RSI at 65 confirms momentum continuation, providing a stable foundation for intraday trend trades during expiry hours[cite: 3].
04 5M Execution & Scalper View
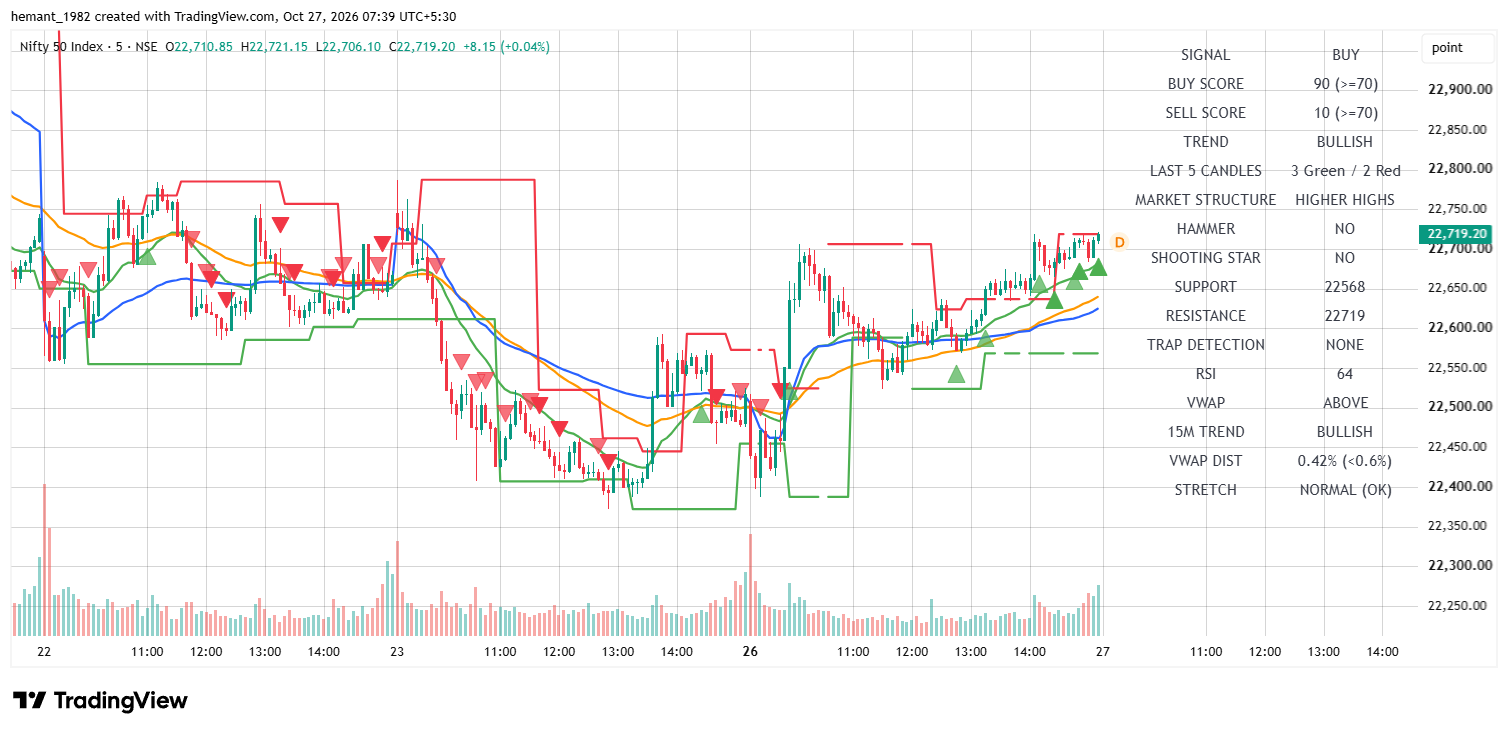
NIFTY 50 5M Chart — Bullish scalp structure displaying Higher Highs with immediate support at 22,568 and resistance at 22,719[cite: 1].
Timeframe Metric
Institutional Value
Technical & Strategy Interpretation
5M Trend / Signal
BULLISH / BUY
Intraday trend is strongly bullish[cite: 1]; Buy Score 90 vs Sell Score 10[cite: 1].
RSI (14) Momentum
64 (Bullish)
Active intraday momentum supporting upward continuation[cite: 1].
The 5-minute scalping grid displays Higher Highs and clean VWAP alignment (+0.42%)[cite: 1]. With an intraday Buy Score of 90, scalpers can leverage dip opportunities above the 22,568 support zone[cite: 1].
05 Institutional Price Map & Strike Confluence
Price Level
Role & Timeframe
Derivatives & Expiry Implications
22,787
1H Macro Resistance Ceiling
Heavy CE Writing Wall — Key upside pin ceiling[cite: 2].
22,719.20
Current Spot Benchmark / 5M Resistance
Live session pivot level & breakout barrier[cite: 1, 2, 3].
22,706
15M Tactical Resistance
Immediate tactical breakout zone[cite: 3].
22,568
5M Intraday Scalp Support Floor
Immediate scalp defense floor[cite: 1].
22,524
15M Tactical Support Floor
Intermediate tactical defense level[cite: 3].
22,372
1H Macro Support Floor
Heavy PE Writing Base — Major structural floor[cite: 2].
06 Professional Expiry Market Outlook
NIFTY 50 enters Expiry Day with aligned BUY signals on lower timeframes (5M & 15M)[cite: 1, 3] and healthy momentum above VWAP[cite: 1, 2, 3].
Bottom Line Expiry Execution Plan
Bullish Intraday Alignment on Expiry Day. Focus on Buy on Dips Near Support.
Look for intraday pullback entries around 22,568–22,600, targeting upside movement toward 22,787[cite: 1, 2]. Strict risk management and stop placement below 22,524 are essential to protect capital during afternoon settlement volatility[cite: 3].
Educational Disclaimer: This technical market report is published strictly for educational purposes. Futures, options, and derivatives trading involve significant risk of financial loss. Content does not constitute investment advice or direct buy/sell recommendations. Always consult a certified financial advisor before trading derivatives.
Comprehensive NIFTY 50 technical analysis update for 22 October 2026, featuring multi-timeframe insights, live spot benchmarks, institutional support and resistance zones, and derivatives execution strategies.
NIFTY 50 trades in a tight equilibrium around 22,503.20 as we navigate the weekly expiry cycle. Access complete multi-timeframe technical analysis across 1H, 15M, and 5M charts along with actionable futures trigger corridors and options strike strategies for Call and Put traders.
Comprehensive Nifty 50 technical analysis update covering live index spot action at 22,938.60, multi-timeframe trends, VWAP levels, RSI momentum, and key support-resistance zones
Live NIFTY 50 technical report for 26 October 2026 covering 1H, 15M, and 5M timeframe confluences, options strike strategies, key support and resistance levels, and intraday scalping blueprints
Discover the latest Nifty 50 technical report for 23 October 2026. Review spot benchmarks at 22,667.25, 1H/15M/5M trend confluences, institutional support zones, and actionable options strategies.