NIFTY 50 is trading at 22,939.25 showing powerful multi-timeframe bullish alignment across all key timeframes (1H, 15M, and 5M) with strong BUY signals active across the board.
The market shows strong upward momentum following a clear higher-high structure on the 1H chart and consistent bullish candle prints. RSI stands strong at 64 (1H), 75 (15M), and 66 (5M), with price trading firmly ABOVE VWAP across timeframes. Key immediate support rests at 22,799 / 22,830, while near-term resistance is mapped at 22,871 on lower timeframes and 23,000 psychological resistance overhead.
Price action around 22,939.25 demonstrates strong bullish control across all intervals. With Buy Scores ranging from 70 to 90 and Sell Scores at low levels (10 to 45), buyers are firmly driving market direction. Dips toward intraday VWAP support offer strategic entry points toward 23,000.
02 1H Macro Structural View
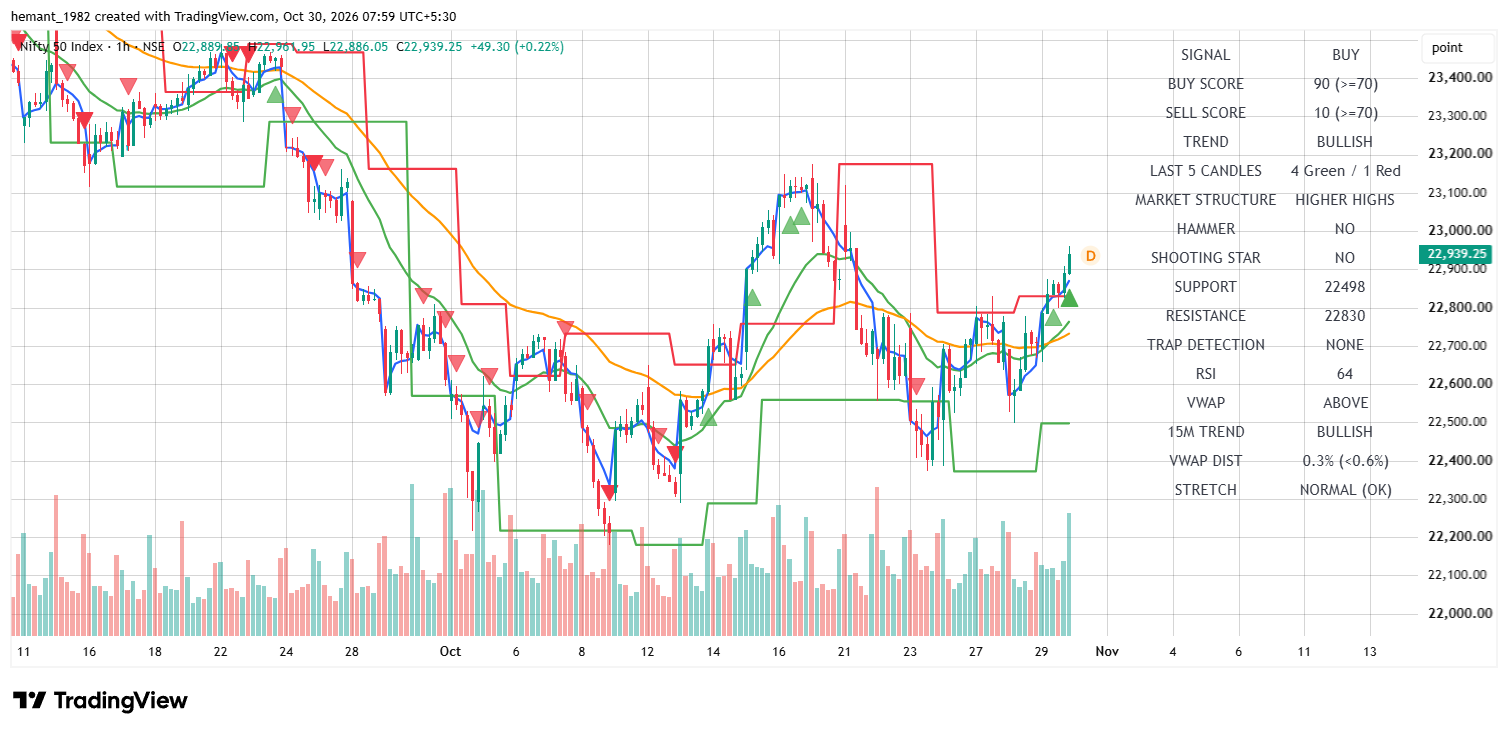
NIFTY 50 1H Chart — High conviction BUY signal (Buy Score 90) with higher highs structure, spot trading at 22,939.25 above support at 22,498.
Timeframe Metric
Institutional Value
Technical & Strategy Interpretation
1H Trend / Signal
BULLISH / BUY
Strong macro momentum; Buy Score 90 vs Sell Score 10.
RSI (14) Momentum
64 (Strong Bullish)
Expanding upside momentum without overbought exhaustion.
Candle Structure
4 Green / 1 Red
Higher Highs structure; Hammer: NO, Shooting Star: NO.
VWAP & Stretch
ABOVE (0.30%)
VWAP Distance <0.6% indicates NORMAL (OK) price stretch.
Major Resistance
22,830
Cleared resistance floor now acting as trailing support base.
Major Support
22,498
Heavy Put Writing — Key institutional defense zone.
The 1-hour chart displays a decisive bullish breakout with price marking continuous higher highs. RSI at 64 confirms strong upward expansion while VWAP distance at 0.30% indicates healthy, sustainable price movement without overextension.
03 15M Tactical Setup
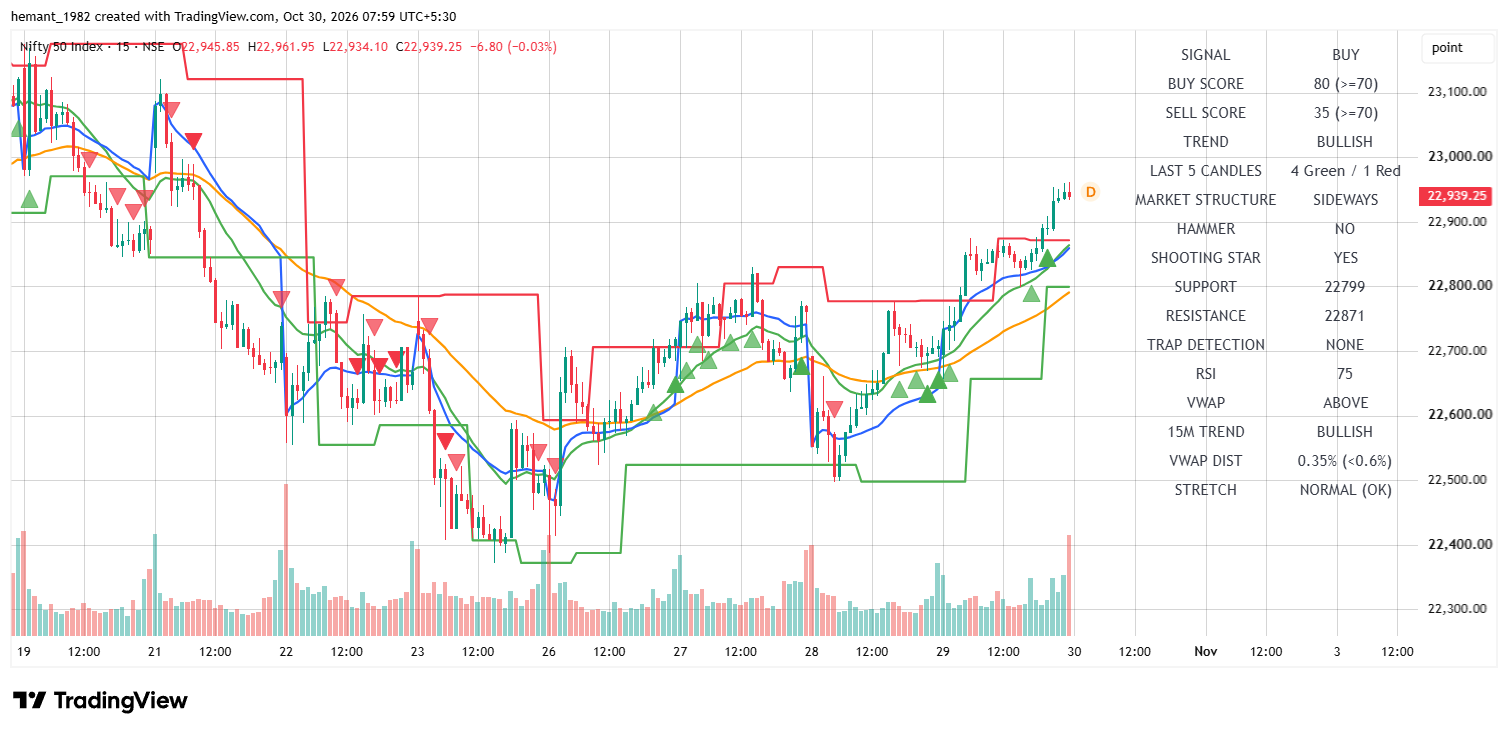
NIFTY 50 15M Chart — Active BUY signal (Buy Score 80) pushing towards 23,000, supported at 22,799 with RSI at 75.
The 15-minute tactical chart shows strong bullish momentum pushing spot to 22,939.25. While RSI reaching 75 warrants caution regarding minor intraday pullbacks, price continues to trade well above VWAP with solid support established at 22,799.
04 5M Execution & Scalper View
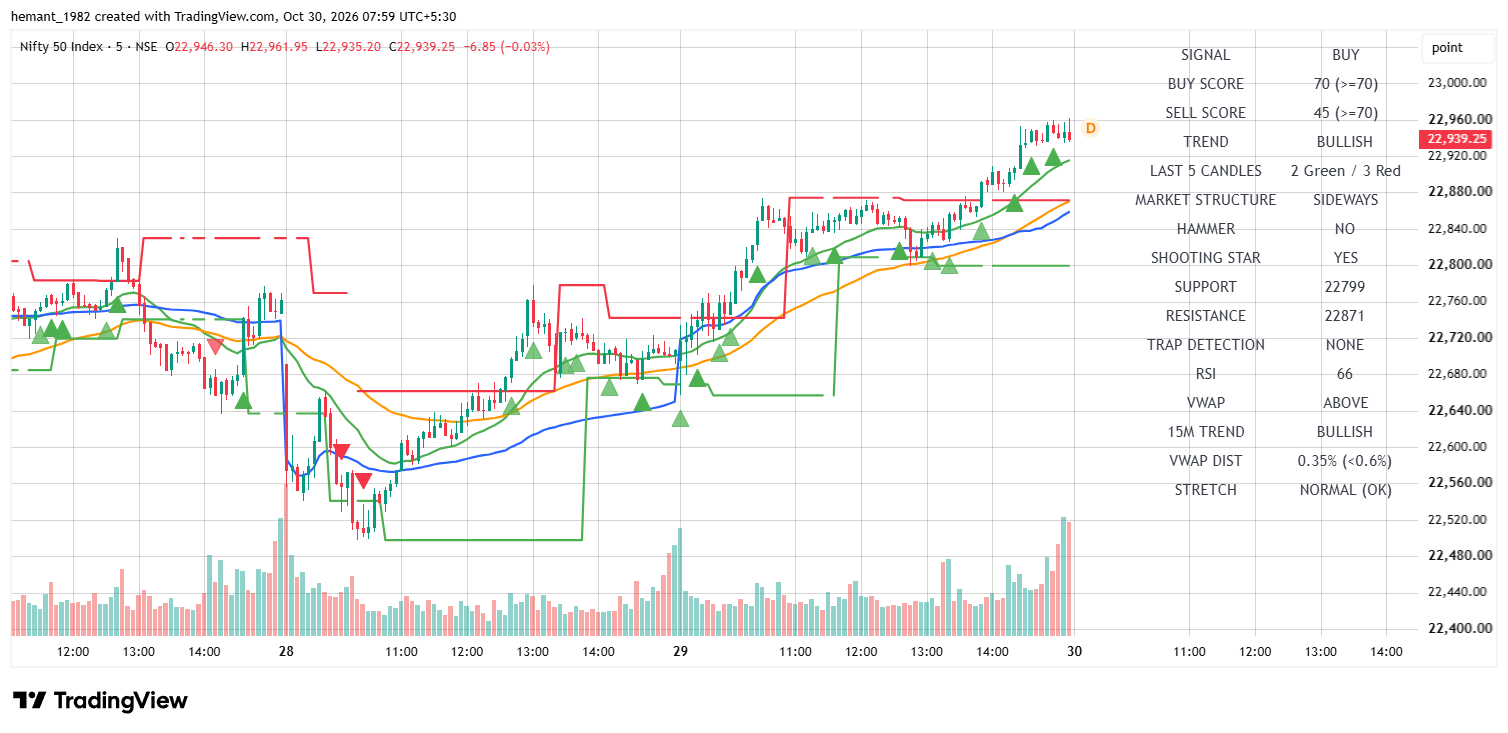
NIFTY 50 5M Chart — Active BUY signal (Buy Score 70) with spot at 22,939.25, support at 22,799 and RSI at 66.
Timeframe Metric
Institutional Value
Technical & Strategy Interpretation
5M Trend / Signal
BULLISH / BUY
Intraday scalping trend is bullish; Buy Score 70 vs Sell Score 45.
The 5-minute scalping chart confirms active BUY signals with price sustaining above 22,920 levels. Immediate support at 22,799 serves as a solid base for short-term long setups.
05 Institutional Price Map & Strike Confluence
Price Level
Role & Timeframe
Derivatives & Strike Implications
23,000
Psychological / Macro Overhead Barrier
Heavy CE Resistance Zone — Next major upside target.
22,939.25
Current Spot Benchmark
Live market quote / equilibrium level.
22,871
5M / 15M Technical Resistance
Intermediate breakout conversion support.
22,830
1H Structural Resistance-Turned-Support
Key intraday pullback floor.
22,799
5M / 15M Technical Support Floor
Immediate tactical risk management pivot.
22,498
1H Macro Support Base
Heavy PE Defense Wall — Major structural floor.
06 Professional Market Outlook
NIFTY 50 presents an aligned bullish structure across 1H, 15M, and 5M timeframes. With Buy Scores consistently meeting or exceeding 70, price trading above VWAP, and key technical levels broken on the upside, the market outlook favors buying on pullbacks toward immediate support zones.
Maintain a bullish bias while spot trades above 22,799 / 22,830. Target momentum moves toward 23,000 with disciplined stops below key support levels.
Educational Disclaimer: This technical market report is published strictly for educational purposes. Futures, options, and derivatives trading involve significant risk of financial loss. Content does not constitute investment advice or direct buy/sell recommendations. Always consult a certified financial advisor before trading derivatives.
Live NIFTY 50 technical report for 26 October 2026 covering 1H, 15M, and 5M timeframe confluences, options strike strategies, key support and resistance levels, and intraday scalping blueprints
NIFTY 50 displays strong short-term bullish momentum on October 29, 2026, highlighted by an active 15M BUY signal with a Buy Score of 95 while consolidating below key macro resistance
Today is expiry day for NIFTY 50 as spot trades at 23,138.45 with bullish multi-timeframe structure across 1H, 15M, and 5M charts. Analyze key trigger corridors, VWAP levels, and zero-hero options setups for today’s session
Discover a complete XAUUSD analysis framework that combines technical analysis, fundamental drivers, trading sessions, and smart risk management to improve your gold trading results and recover losses without emotional trading.
Comprehensive NIFTY 50 technical analysis update for 22 October 2026, featuring multi-timeframe insights, live spot benchmarks, institutional support and resistance zones, and derivatives execution strategies.
Get live NIFTY 50 technical intelligence for 28 October 2026. Spot is trading at 22,762.00 with strong 5M/15M bullish momentum (BUY signal, Score 80) and key support at 22,637.