NIFTY 50 trades at 22,707.05 showing strong short-term bullish momentum on lower timeframes (15M Buy Score 95/100 with an active BUY signal) while maintaining a sideways-to-bearish stance on the higher 1H macro frame.
The market structure shows intraday accumulation above VWAP across all timeframes with prices holding steady near key session highs. The 15M timeframe prints an active BUY signal with a high Buy Score of 95, backed by RSI momentum at 55. Primary intraday support rests at 22,669 / 22,498 while immediate overhead resistance caps near 22,742 / 22,778. Traders should look for breakout confirmation above 22,742–22,778 for continued upside momentum.
Price action around 22,707.05 exhibits clear intraday strength above VWAP. With the 15-minute frame generating a high Buy Score of 95 versus a Sell Score of 10, buyers have the upper hand on lower timeframes. Long positions favor holding above support at 22,669 with targets set toward 22,778 and 22,830.
02 1H Macro Structural View
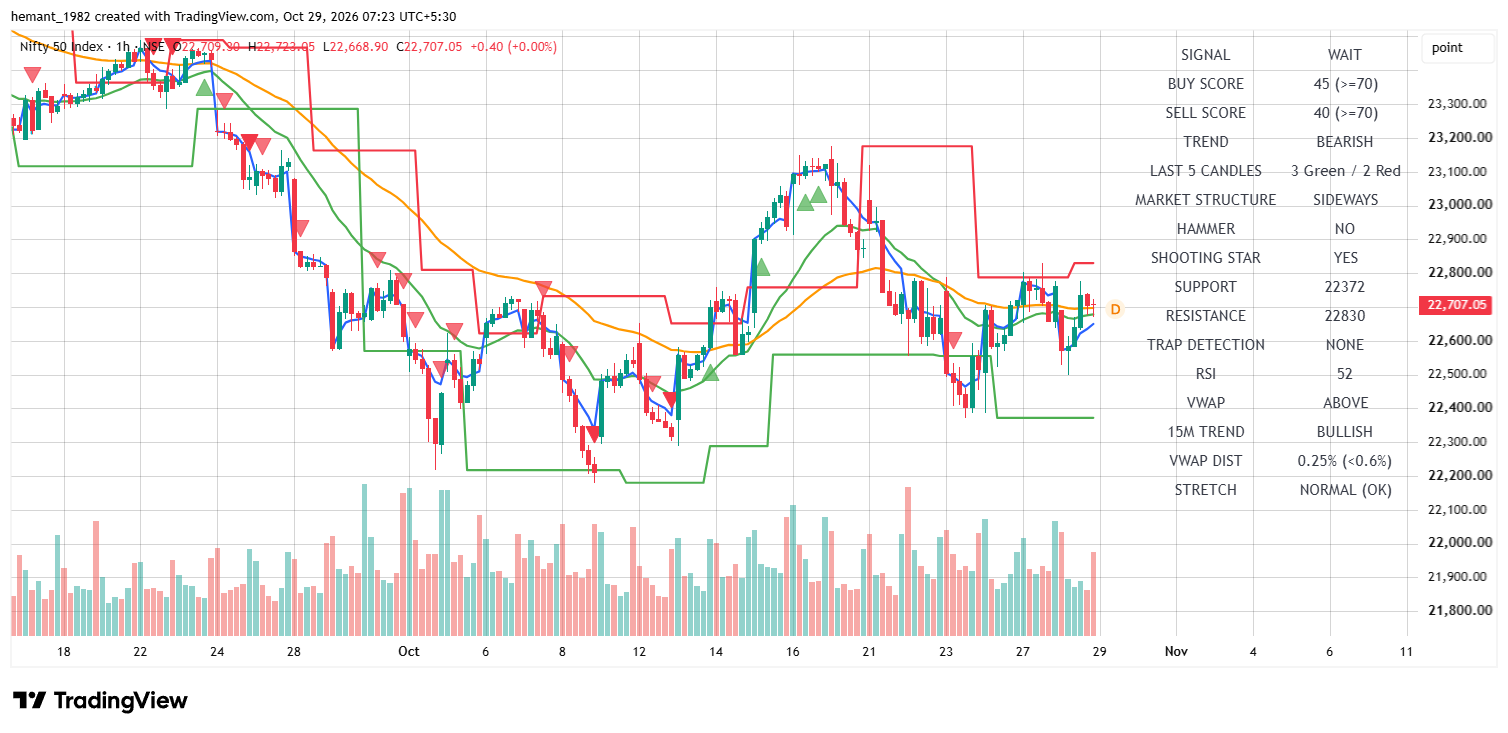
NIFTY 50 1H Chart — Price holds above VWAP at 22,707.05 with support at 22,372 and overhead resistance at 22,830.
Market Structure SIDEWAYS; Hammer: NO, Shooting Star: YES.
VWAP & Stretch
ABOVE (0.25%)
VWAP Distance <0.6% indicates NORMAL (OK) price stretch.
Major Resistance
22,830
Heavy Call Writing — Macro resistance ceiling.
Major Support
22,372
Heavy Put Writing — Major macro floor.
The 1-hour chart displays macro stabilization after recent pullbacks, with spot trading at 22,707.05 above VWAP (+0.25%). RSI at 52 shows steady balance while the 15M Trend indicator on the 1H panel reflects a bullish alignment.
03 15M Tactical Setup
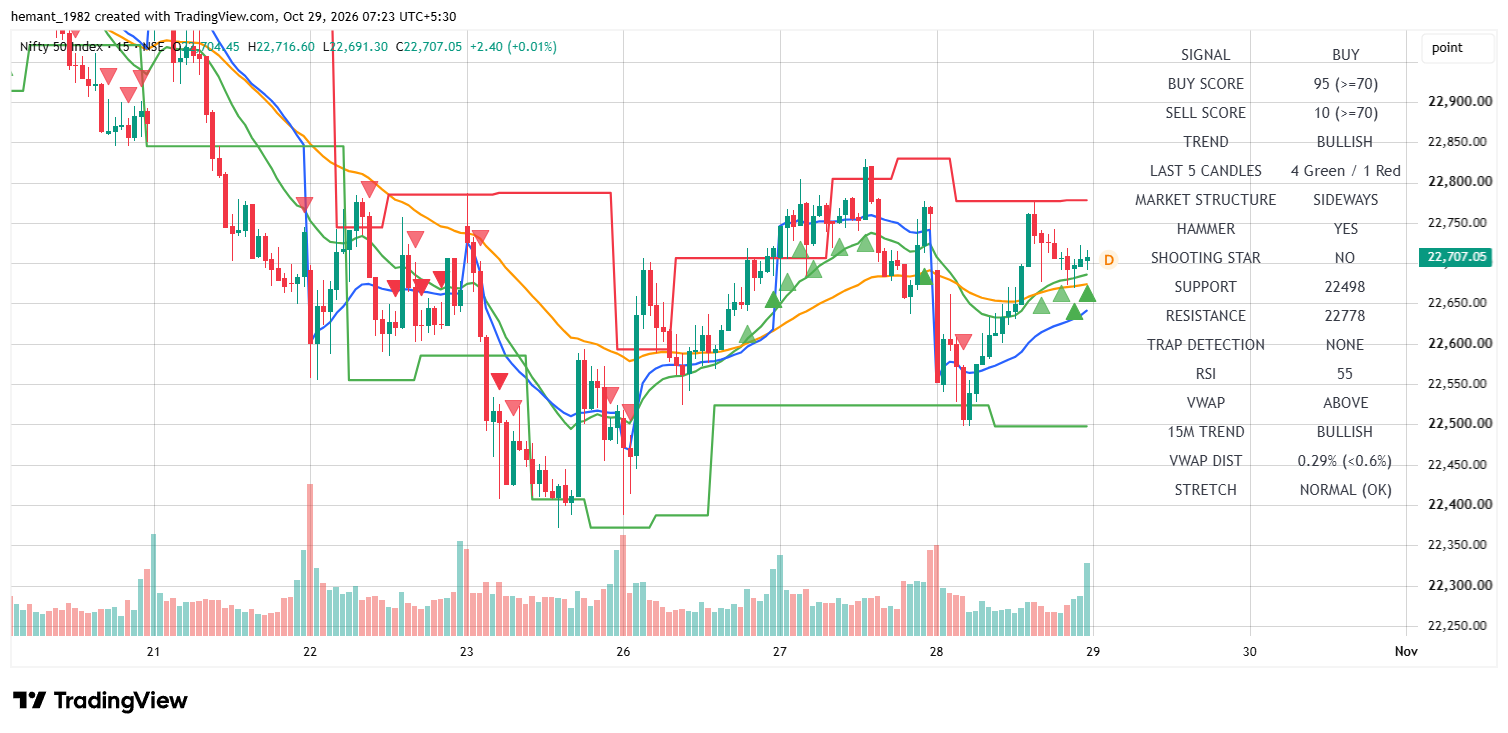
NIFTY 50 15M Chart — Active BUY signal with Buy Score 95, trading above support at 22,498 and testing resistance at 22,778.
Timeframe Metric
Institutional Value
Technical & Strategy Interpretation
15M Trend / Signal
BULLISH / BUY
Tactical trend is bullish; Buy Score 95 vs Sell Score 10.
Price trading above VWAP; stretch marked NORMAL (OK).
Tactical Resistance
22,778
Upper supply barrier and immediate breakout target.
Tactical Support
22,498
Primary 15M structural support floor.
The 15-minute tactical structure shows strong bullish alignment with a BUY signal and a high Buy Score of 95. Supported by a Hammer pattern on recent candles, RSI at 55, and prices above VWAP (+0.29%), buyers remain in control of the intraday frame.
04 5M Execution & Scalper View
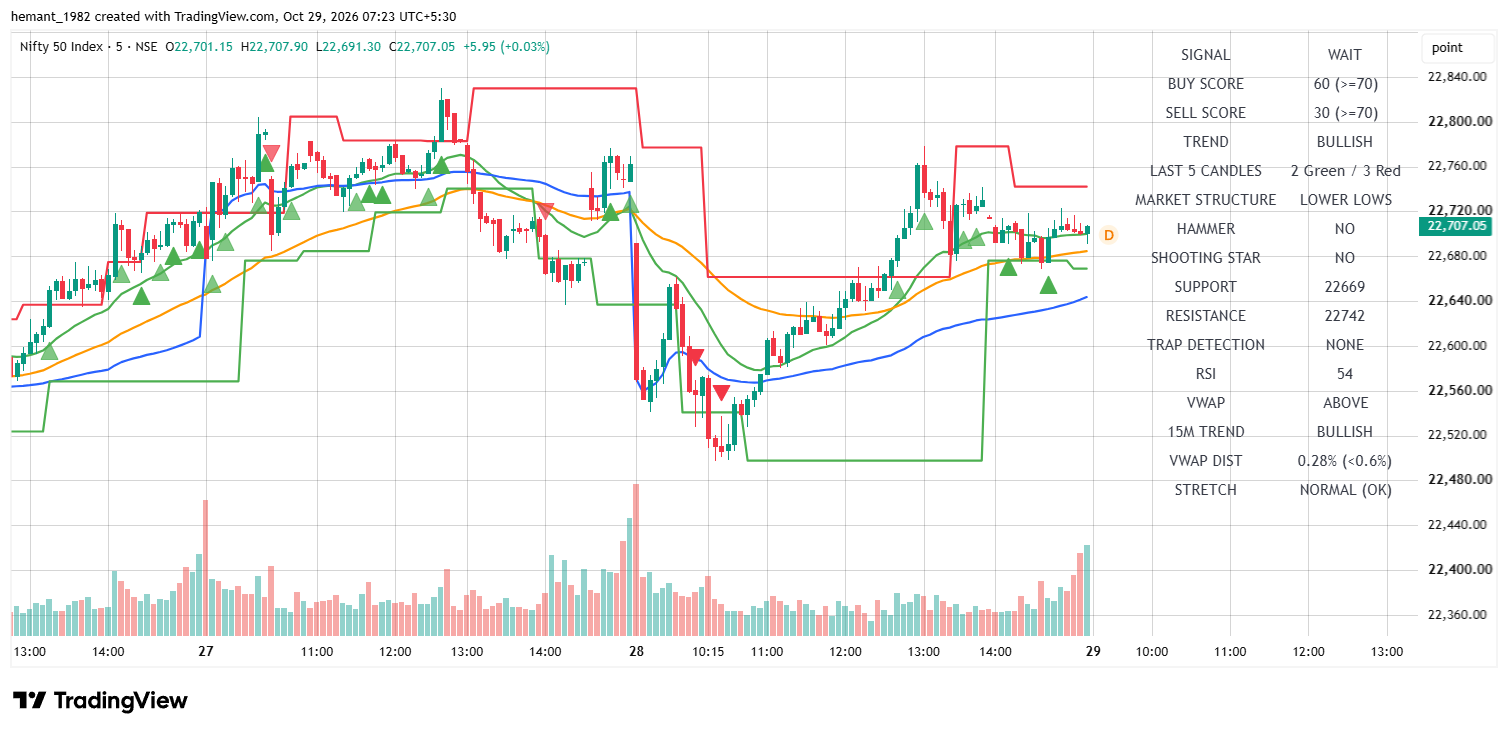
NIFTY 50 5M Chart — Intraday scalping grid showing support at 22,669 and immediate scalp resistance at 22,742.
Timeframe Metric
Institutional Value
Technical & Strategy Interpretation
5M Trend / Signal
BULLISH / WAIT
Intraday trend is bullish; Buy Score 60 vs Sell Score 30.
RSI (14) Momentum
54 (Bullish)
Holding positive momentum above 50.
Candle Structure
2 Green / 3 Red
Market Structure LOWER LOWS; Hammer: NO, Shooting Star: NO.
VWAP & Stretch
ABOVE (0.28%)
Price holds firmly above VWAP; stretch marked NORMAL (OK).
Scalp Resistance
22,742
Immediate intraday scalp resistance barrier.
Scalp Support
22,669
Immediate intraday scalp support floor.
The 5-minute scalping setup indicates positive posture above VWAP (+0.28%) with RSI at 54 and a Buy Score of 60. The tight execution range sits between support at 22,669 and scalp resistance at 22,742.
05 Institutional Price Map & Strike Confluence
Price Level
Role & Timeframe
Derivatives & Strike Implications
22,830
1H Macro Resistance Ceiling
Heavy CE Writing Wall — Primary macro supply cap.
22,778
15M Tactical Resistance
Tactical upside breakout target.
22,742
5M Intraday Scalp Resistance
Immediate scalping breakout barrier.
22,707.05
Current Spot Benchmark
Live session market price.
22,669
5M Intraday Scalp Support Floor
Immediate intraday defense level.
22,498
15M Tactical Support Floor
Key short-term structural floor.
22,372
1H Macro Support Floor
Heavy PE Writing Wall — Institutional defense zone.
06 Professional Market Outlook
NIFTY 50 exhibits strong short-term bullish momentum around 22,707.05, highlighted by an active 15M BUY signal with a Buy Score of 95. With price holding above VWAP across all timeframes and RSI holding above 50, intraday bias favors buyers.
Look for buying opportunities on minor dips toward 22,669 support or upon a clean breakout above 22,742, targeting 22,778 and 22,830 with strict stops placed below 22,669.
Educational Disclaimer: This technical market report is published strictly for educational purposes. Futures, options, and derivatives trading involve significant risk of financial loss. Content does not constitute investment advice or direct buy/sell recommendations. Always consult a certified financial advisor before trading derivatives.
Tired of getting wicked out of your gold trades during Fed rate decisions? Learn how institutional algorithms hunt stop-losses and discover a bulletproof 3-step framework to trade XAU/USD safely during FOMC volatility
NIFTY 50 trades at 22,719.20 on Expiry Day with strong bullish momentum across lower timeframes (5M Buy Score: 90, 15M Buy Score: 105). Discover key support and resistance zones for your expiry trades
Discover a complete XAUUSD analysis framework that combines technical analysis, fundamental drivers, trading sessions, and smart risk management to improve your gold trading results and recover losses without emotional trading.
NIFTY 50 remains under pressure after a sharp decline, but the latest rebound from the 22,200–22,250 zone has created an important technical decision point. Explore key support and resistance levels, trend structure, breakout signals, and practical trading strategies for NIFTY traders.
NIFTY 50 trades in a tight equilibrium around 22,503.20 as we navigate the weekly expiry cycle. Access complete multi-timeframe technical analysis across 1H, 15M, and 5M charts along with actionable futures trigger corridors and options strike strategies for Call and Put traders.
Today is expiry day for NIFTY 50 as spot trades at 23,138.45 with bullish multi-timeframe structure across 1H, 15M, and 5M charts. Analyze key trigger corridors, VWAP levels, and zero-hero options setups for today’s session